The Canon 1D Mark IV Digital Camera Review:
Sensor Noise, Dynamic Range, and Full Well Analysis
by Roger N. Clark
All images, text and data on this site are copyrighted.
They may not be used except by written permission from Roger N. Clark.
All rights reserved.
If you find the information on this site useful,
please support Clarkvision and make a donation (link below).
This page shows an analysis of noise, dynamic range, and full well capacity
of a Canon 1D Mark IV camera.
It also shows the dark current and noise from thermal
dark current as a function of temperature.
Procedures for performing this analysis are described in:
Procedures for Evaluating Digital Camera Noise, Dynamic Range, and Full
Well Capacities; Canon 1D Mark II Analysis
The lowest possible noise from a system detecting light is the noise due to Poisson
statistics from the random rate of the arrival of photons. This is called photon
statistics, or photon noise. Noise from the electronics will add to the photon noise.
Noise in Canon 1D Mark IV images is limited by photon statistics at high signal levels
and by electronic noise from reading the sensor (called readout noise) and
noise from the downstream electronics at very low signal levels. In the case of
high signal levels, a system that is photon statistics
limited enables us to directly measure how many photons the sensor captures, and by
increasing the exposure, we can determine how many photons are required to saturate
the sensor. That is called the full well capacity, or simply, maximum signal capacity.
With data on the lowest noise to the highest signal, we can then determine the dynamic
range of the sensor.
The data and analysis results below show how the canon 1D Mark IV sensor performs.
Table 1 shows the results and these results are shown on the graphs at
Digital Sensor Performance summary
for comparison with other cameras. The data show
that the 1D4 is performing significantly above other sensors with
similar sized pixels and even above some older cameras with larger pixels
at the time of this writing.
Canon in their white paper on the 1D4
(
PDF reference here) states they have
made several improvements to the focal plane assembly, including higher transmission
of the color Bayer filters over each pixel, better fill factor, and gapless
micro lenses. These combine to deliver a high signal (collect more photons)
in a given exposure, and the results below confirm Canon's claims.
The read noise, reaching a low 0f only 1.7 electrons at ISO 12,800 is the lowest
I have yet measured and the lowest I have seen on any room-temperature sensor.
But even more impressive than the high signal and low read noise, is the
far better control of fixed pattern noise. Figures 1 and 2 show histogram and a
highly stretched
image of the read noise at ISO 12,800. It is very difficult to see any fixed pattern
noise. The control of fixed pattern noise and the very low read noise enables the
best high ISO/low light performance I have seen. It will be interesting to
see some astrophotos with this camera.
              Table 1
-------------------------------------------------
               Apparent  Maximum     Measured
  ISO  Gain   Read Noise  signal    Dynamic range
       e/DN  (electrons) (electrons)   stops

   100  4.20     22.2     55600        11.3
   200  2.10     11.5     27800        11.2
   400  1.05      6.6     13900        11.0
   800  0.52      4.0      6900        10.8
  1600  0.26      2.9      3400        10.2
  3200  0.13      2.3      1700         9.5
  6400  0.066     1.9       860         8.8
 12800  0.033     1.7       430         8.0
 25600  0.016     1.7 e     215         7   e
 51200  0.008     1.7 e     108         6   e
102400  0.004     1.7 e      54         5   e


e = estimated by extrapolation

Pixel pitch: 5.7 microns.
16.1 megapixels.
S/N on 18% gray card, ISO  100 = 100.
S/N on 18% gray card, ISO 1600 =  24.7
Sensor Full Well Capacity at lowest ISO: 55,600 electrons.
Sensor dynamic range = 55600/1.7 = 32,700 = 15.0 stops.
  (note: limit read noise to ISO that give at least 8 stops dynamic range)
ISO at unity gain (scaled to 12 bit) = 1680 (14-bit unity gain = ISO 420).

Pixel linear density = 175.4 pixels / mm
Pixel density = 30,780 pixels / square mm
Sensor maximum signal density at ISO  200 = 856   electrons / square micron
Sensor maximum signal density at ISO 1600 = 104.6 electrons / square micron
Sensor dynamic range density at ISO 1600 = 17.7 stops dynamic range / square mm

Sensor read noise density (best read noise) = 298 electrons / square mm

Low Light sensitivity Factor: 988.   (=12-bit unity gain / read noise)
New Low Light sensitivity Factor:  36.1  (= sensor max signal density at ISO 1600 / read noise at ISO 1600)

Full Sensor Apparent Image Quality, FS-AIQ = 80.5.
Focal Length Limited Apparent Image Quality, ISO 1600, Constant output Size, FLL-AIQ1600 = 60
Values in the above table are described at
Digital Sensor Performance summary. Data used to derive the above
parameters are given in Appendix 1.
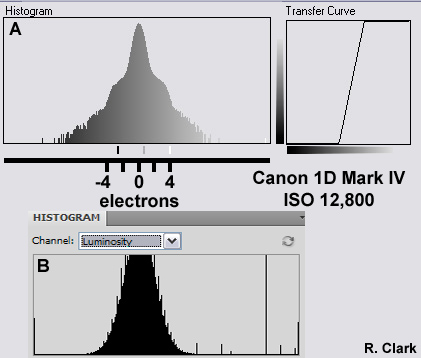
Figure 1. Histogram showing the noise distribution of the read noise in a Canon 1D mark IV
camera. Histogram limits are 0 to 1024 out of 0 to 16383 original camera
levels (DN). The image of this stretched histogram, indicated by the 3 tick
marks below the histogram, whose limits are
432 to 644 original camera DN, are shown in Figure 2. The data range is 0 to 33.8
electrons from the left to right limits of the graph. The scale below the
three marks shows the range in electrons.
The histogram vertical scale is logarithmic in A, and linear in B (Photoshop).
The electron scale only applies the histogram A; the horizontal scale in B is not
linear.
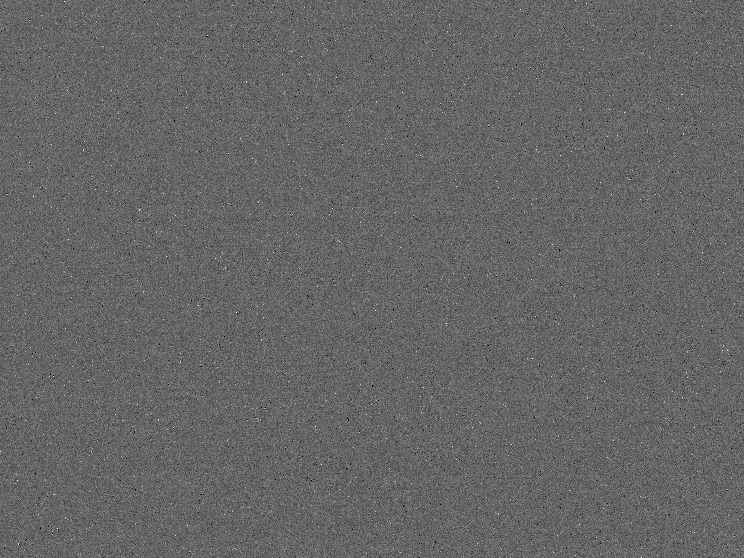
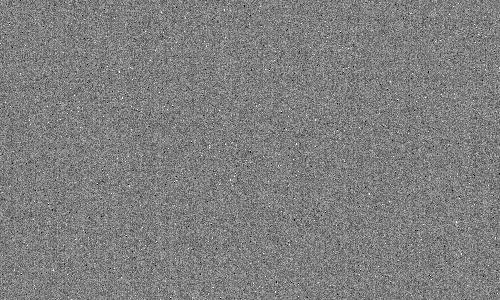
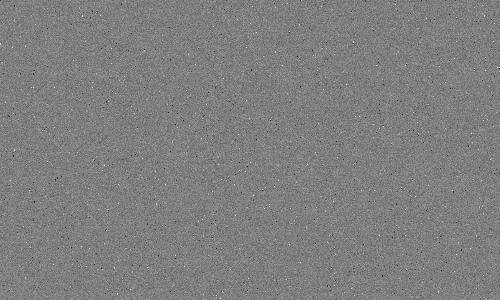
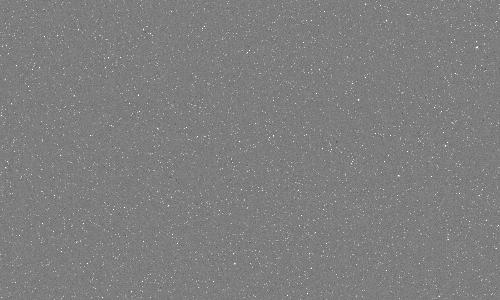
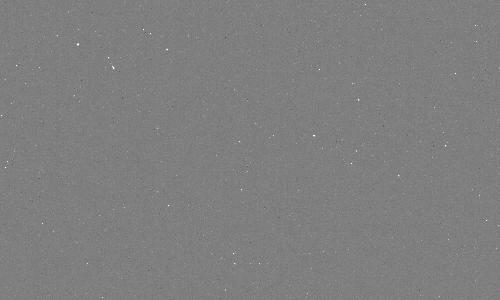
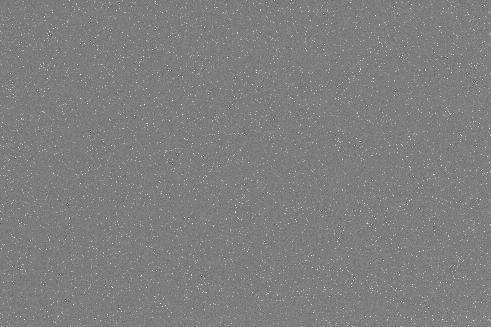
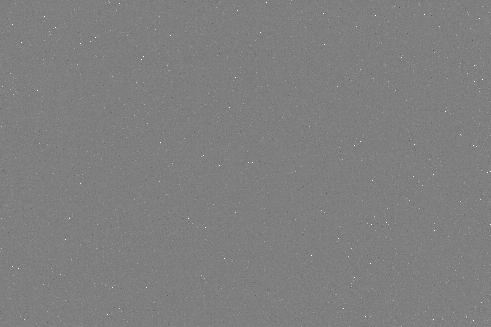
Figure 2. Stretched read noise from the Canon 1D Mark IV at ISO 12,800.
Note that pattern noise is barely perceptible. The histogram of this image
is in Figure X. Minimum in this image = 432 and max = 644 in original camera
DN, out of 0 to 16383 (14-bits). That is a range of 7 electrons from black to
white in the image. This image is direct from a single raw file, with no
demosaicking (from dcraw). Note the black and white pixels are due to clipping
the levels, and are not hot or dead pixels.
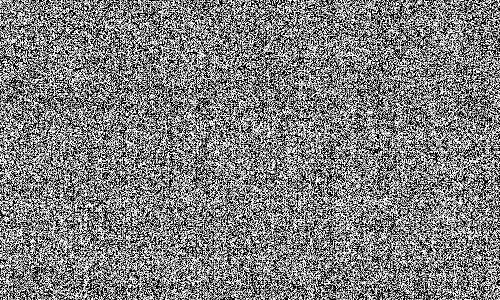
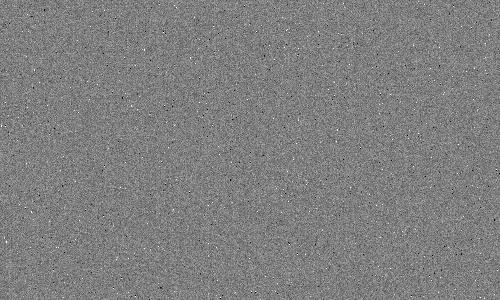
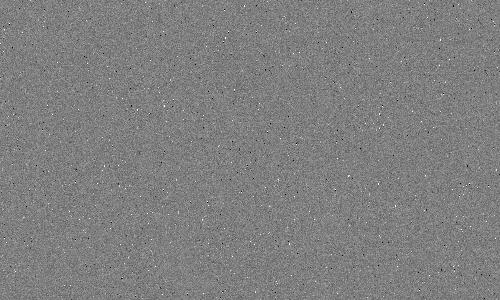
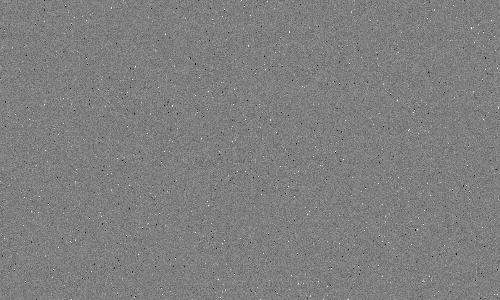
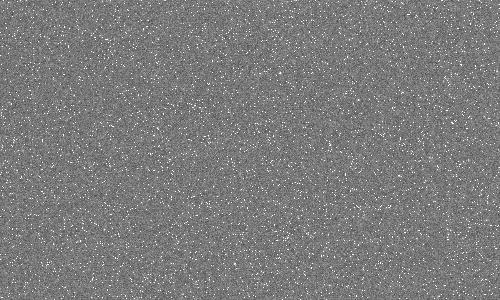
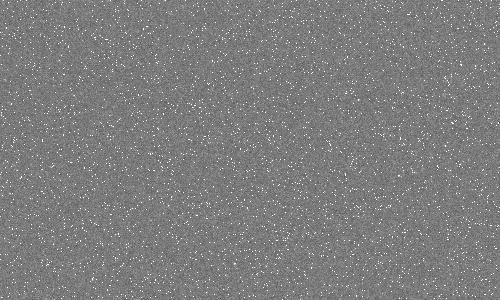
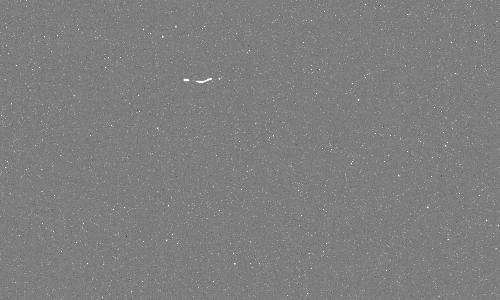
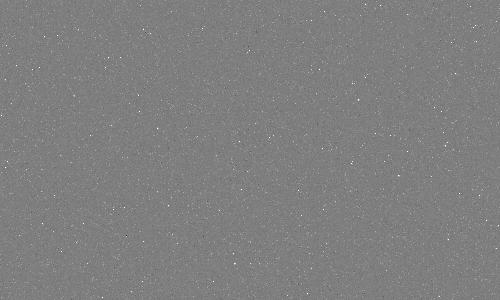
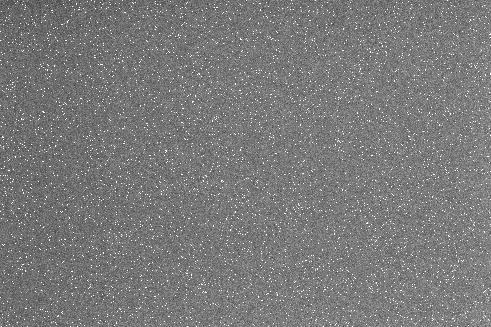
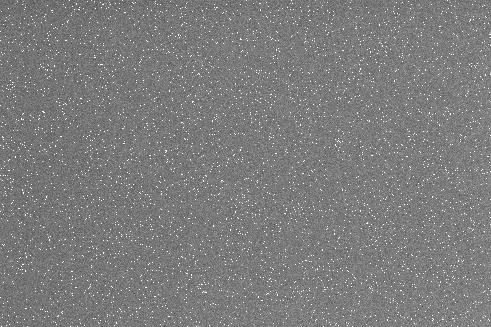
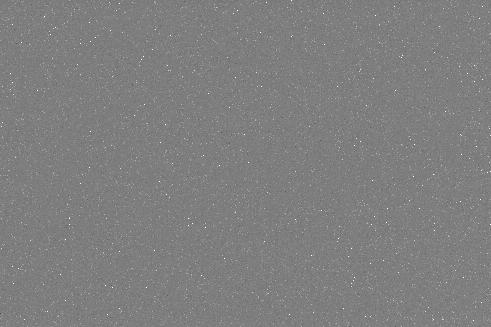
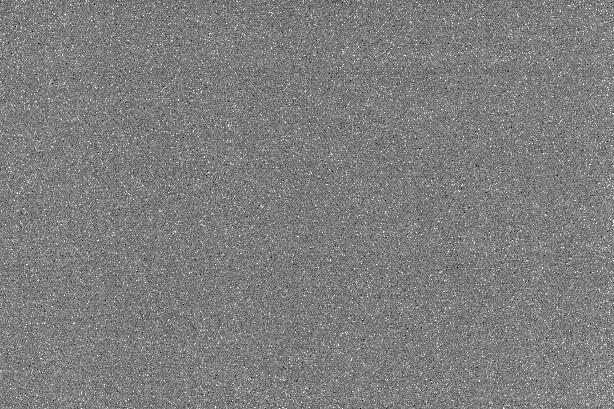
Table 2 shows the noise as a function of ISO in image form. The images illustrate several
things: 1) lower banding noise at higher ISOs. 2) Better detection of smaller signals at
higher ISOs (the random noise decreases). 3) At a certain high ISO, improvements decrease,
meaning there is no benefit to higher ISO. Note, ISO is a post sensor gain and does
not increase sensitivity. Increasing ISO digitizes a smaller range (see Table 1) but does
improve the noise floor. The 1DIV produces images with low fixed pattern noise at ISOs
of 800 and higher.
| Table 2a. Apparent Read Noise, Central Image |
 | ISO 100
Image Range:
-20.00 to 20.00 electrons about the mean
Central 500 x 300 pixel statistics:
min= 8509 electrons
max= 8694 electrons
mean= 8603 electrons
standard deviation= 21.21 electrons |
 | ISO 200
Image Range:
-20.00 to 20.00 electrons about the mean
Central 500 x 300 pixel statistics:
min= 4250 electrons
max= 4353 electrons
mean= 4302 electrons
standard deviation= 11.03 electrons |
 | ISO 400
Image Range:
-20.00 to 20.00 electrons about the mean
Central 500 x 300 pixel statistics:
min= 2100 electrons
max= 2197 electrons
mean= 2151 electrons
standard deviation= 6.35 electrons |
 | ISO 800
Image Range:
-20.00 to 20.00 electrons about the mean
Central 500 x 300 pixel statistics:
min= 1019 electrons
max= 1102 electrons
mean= 1065 electrons
standard deviation= 3.96 electrons |
 | ISO 1600
Image Range:
-20.00 to 20.00 electrons about the mean
Central 500 x 300 pixel statistics:
min= 472 electrons
max= 573 electrons
mean= 532 electrons
standard deviation= 3.00 electrons |
 | ISO 3200
Image Range:
-20.00 to 20.00 electrons about the mean
Central 500 x 300 pixel statistics:
min= 229 electrons
max= 303 electrons
mean= 266 electrons
standard deviation= 2.46 electrons |
 | ISO 6400
Image Range:
-20.00 to 20.00 electrons about the mean
Central 500 x 300 pixel statistics:
min= 96 electrons
max= 170 electrons
mean= 135 electrons
standard deviation= 2.09 electrons |
 | ISO 12800
Image Range:
-20.00 to 20.00 electrons about the mean
Central 500 x 300 pixel statistics:
min= 37 electrons
max= 104 electrons
mean= 67 electrons
standard deviation= 1.91 electrons |
| Table 2a. Apparent Read Noise, Central Image |
| ISO 100
Image Range:
-20.00 to 20.00 electrons about the mean
Central 500 x 300 pixel statistics:
min= 8509 electrons
max= 8694 electrons
mean= 8603 electrons
standard deviation= 21.21 electrons |
| ISO 200
Image Range:
-20.00 to 20.00 electrons about the mean
Central 500 x 300 pixel statistics:
min= 4250 electrons
max= 4353 electrons
mean= 4302 electrons
standard deviation= 11.03 electrons |
| ISO 400
Image Range:
-20.00 to 20.00 electrons about the mean
Central 500 x 300 pixel statistics:
min= 2100 electrons
max= 2197 electrons
mean= 2151 electrons
standard deviation= 6.35 electrons |
| ISO 800
Image Range:
-20.00 to 20.00 electrons about the mean
Central 500 x 300 pixel statistics:
min= 1019 electrons
max= 1102 electrons
mean= 1065 electrons
standard deviation= 3.96 electrons |
| ISO 1600
Image Range:
-20.00 to 20.00 electrons about the mean
Central 500 x 300 pixel statistics:
min= 472 electrons
max= 573 electrons
mean= 532 electrons
standard deviation= 3.00 electrons |
| ISO 3200
Image Range:
-20.00 to 20.00 electrons about the mean
Central 500 x 300 pixel statistics:
min= 229 electrons
max= 303 electrons
mean= 266 electrons
standard deviation= 2.46 electrons |
| ISO 6400
Image Range:
-20.00 to 20.00 electrons about the mean
Central 500 x 300 pixel statistics:
min= 96 electrons
max= 170 electrons
mean= 135 electrons
standard deviation= 2.09 electrons |
| ISO 12800
Image Range:
-20.00 to 20.00 electrons about the mean
Central 500 x 300 pixel statistics:
min= 37 electrons
max= 104 electrons
mean= 67 electrons
standard deviation= 1.91 electrons |
Dark Current and Thermal Noise
On long exposures, electrons collect in the sensor due to thermal
processes. This is called the thermal dark current. As with photon noise,
the noise from thermal dark current is the square root of the
signal. One can subtract the dark current level, but not the noise
from the dark current. Many modern digital cameras have on sensor
dark current suppression, but this does not suppress the noise
from the dark current. It does, however, prevent uneven
zero levels that plagues cameras before the innovation (Canon
cameras before circa 2008). Examples of this problem are seen
at:
Long-Exposure Comparisons.
The dark versus temperature for the Canon 1D Mark IV is shown in Table 3.
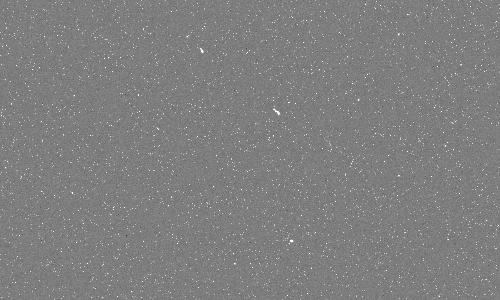
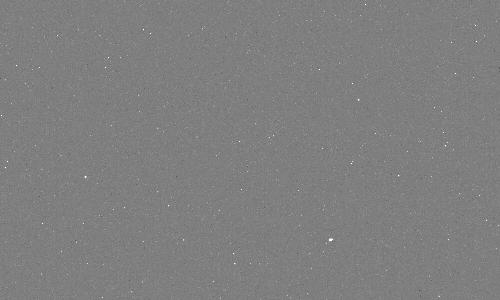
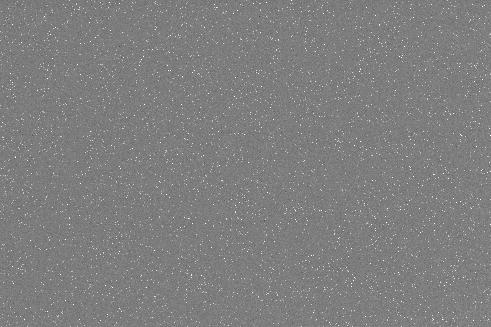
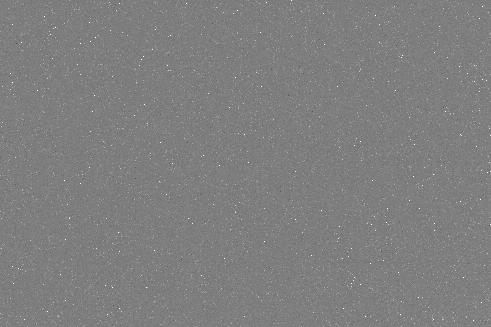
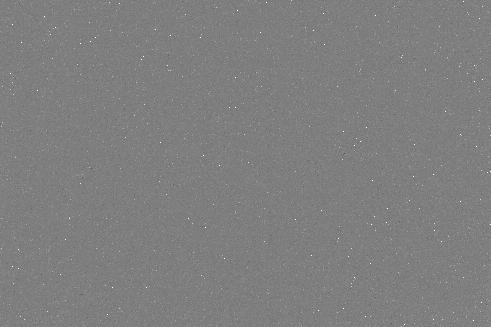
The uniformity of the 1D Mark IV long exposure dark frames, Tables 4a, 4b, 4c
is outstanding. There is no noticeable banding, enabling multiple
frames to be averaged, or very long exposures to be made without
annoying pattern noise. Thermal noise ultimately limits the weakest
signals that can be detected. Thermal dark current is very
temperature dependent, so only compare these values to other sensors made
at the same temperature.
The dark current increased 16.1 times in the 1DIV from -3 to 23 degrees C
or doubling about every 6.5 degrees C on average. Note too that the
lower the temperature, the fewer hot pixels show in the image.
This makes long exposure night imaging difficult in hot environments,
but this is true of all uncooled digital cameras.
                             Table 3
                 Canon 1D Mark IV Dark Current vs Temperature

                                     Noise from Dark Current in Electrons
 Temperature   Dark current            versus  Exposure Time (seconds)
  (C)   (F)   electrons/sec.    10 sec    30 sec    60 sec    120 sec    300 sec

   26    79     1.263             3.6       6.2       8.7      12.3       19.5
   23    73     1.193             3.5       6.0       8.5      12.0       18.9
   17    63     0.381             2.0       3.4       4.8       6.8       10.7
   17    63     0.315             1.8       3.1       4.4       6.2        9.7
   16    61     0.329             1.8       3.1       4.4       6.3        9.9
   14    57     0.258             1.6       2.8       3.9       5.6        8.8
   14    57     0.277             1.7       2.9       4.1       5.8        9.1
   14    57     0.308             1.8       3.0       4.3       6.1        9.6
   13    55     0.251             1.6       2.7       3.9       5.5        8.7
   12    54     0.255             1.6       2.8       3.9       5.5        8.7
   10    50     0.218             1.5       2.6       3.6       5.1        8.1
    7    45     0.204             1.4       2.5       3.5       4.9        7.8
    5    41     0.158             1.3       2.2       3.1       4.4        6.9
    0    32     0.157             1.3       2.2       3.1       4.3        6.9
   -3    27     0.074             0.9       1.5       2.1       3.0        4.7
   -5    23     0.070             0.8       1.5       2.1       2.9        4.6
| Table 4a. Thermal Noise, Central Image |
 |
ISO 1600
Exposure= 595 seconds
T= 29 C
Image Range:
-100.00 to 100.00 electrons about the mean
Central 500 x 300 pixel statistics:
min= 488 electrons
max= 3652 electrons
mean= 549 electrons
standard deviation= 39.25 electrons |
 |
ISO 1600
Exposure= 595 seconds
T= 26 C
Image Range:
-100.00 to 100.00 electrons about the mean
Central 500 x 300 pixel statistics:
min= 483 electrons
max= 3651 electrons
mean= 542 electrons
standard deviation= 27.57 electrons |
 |
ISO 1600
Exposure= 595 seconds
T= 17 C
Image Range:
-100.00 to 100.00 electrons about the mean
Central 500 x 300 pixel statistics:
min= 462 electrons
max= 3651 electrons
mean= 535 electrons
standard deviation= 15.34 electrons |
 |
ISO 1600
Exposure= 595 seconds
T= 13 C
Image Range:
-100.00 to 100.00 electrons about the mean
Central 500 x 300 pixel statistics:
min= 489 electrons
max= 3651 electrons
mean= 534 electrons
standard deviation= 12.57 electrons |
 |
ISO 1600
Exposure= 595 seconds
T= 10 C
Image Range:
-100.00 to 100.00 electrons about the mean
Central 500 x 300 pixel statistics:
min= 472 electrons
max= 3651 electrons
mean= 533 electrons
standard deviation= 11.75 electrons |
 |
ISO 1600
Exposure= 595 seconds
T= 7 C
Image Range:
-100.00 to 100.00 electrons about the mean
Central 500 x 300 pixel statistics:
min= 467 electrons
max= 3651 electrons
mean= 533 electrons
standard deviation= 11.39 electrons |
 |
ISO 1600
Exposure= 595 seconds
T= 0 C
Image Range:
-100.00 to 100.00 electrons about the mean
Central 500 x 300 pixel statistics:
min= 486 electrons
max= 3347 electrons
mean= 533 electrons
standard deviation= 10.09 electrons |
 |
ISO 1600
Exposure= 595 seconds
T= -5 C
Image Range:
-100.00 to 100.00 electrons about the mean
Central 500 x 300 pixel statistics:
min= 485 electrons
max= 2562 electrons
mean= 532 electrons
standard deviation= 7.09 electrons |
| Table 4b. Thermal Noise, Full Image, sub-sampled |
 |
ISO 1600
Exposure= 595 seconds
T= 29 C
Image Range:
-100.00 to 100.00 electrons about the mean
Full image statistics:
min= 1 electrons
max= 3655 electrons
mean= 548 electrons
standard deviation= 42.47 electrons |
 |
ISO 1600
Exposure= 595 seconds
T= 26 C
Image Range:
-100.00 to 100.00 electrons about the mean
Full image statistics:
min= 1 electrons
max= 3653 electrons
mean= 541 electrons
standard deviation= 31.19 electrons |
 |
ISO 1600
Exposure= 595 seconds
T= 17 C
Image Range:
-100.00 to 100.00 electrons about the mean
Full image statistics:
min= 0 electrons
max= 3652 electrons
mean= 535 electrons
standard deviation= 19.06 electrons |
 |
ISO 1600
Exposure= 595 seconds
T= 13 C
Image Range:
-100.00 to 100.00 electrons about the mean
Full image statistics:
min= 0 electrons
max= 3652 electrons
mean= 534 electrons
standard deviation= 18.06 electrons |
 |
ISO 1600
Exposure= 595 seconds
T= 10 C
Image Range:
-100.00 to 100.00 electrons about the mean
Full image statistics:
min= 0 electrons
max= 3652 electrons
mean= 533 electrons
standard deviation= 16.68 electrons |
 |
ISO 1600
Exposure= 595 seconds
T= 7 C
Image Range:
-100.00 to 100.00 electrons about the mean
Full image statistics:
min= 0 electrons
max= 3652 electrons
mean= 533 electrons
standard deviation= 16.86 electrons |
 |
ISO 1600
Exposure= 595 seconds
T= 0 C
Image Range:
-100.00 to 100.00 electrons about the mean
Full image statistics:
min= 0 electrons
max= 3652 electrons
mean= 533 electrons
standard deviation= 15.83 electrons |
 |
ISO 1600
Exposure= 595 seconds
T= -5 C
Image Range:
-100.00 to 100.00 electrons about the mean
Full image statistics:
min= 0 electrons
max= 3652 electrons
mean= 532 electrons
standard deviation= 13.36 electrons |
| Table 4c. Thermal Noise, Full Image, sub-sampled |
 |
ISO 1600
Exposure= 595 seconds
T= 0 C
Image Range:
-20.00 to 20.00 electrons about the mean
Full image statistics:
min= 0 electrons
max= 3652 electrons
mean= 533 electrons
standard deviation= 15.83 electrons |
Figure 3. Dark current as a function of temperature for 5 cameras
are compared. The temperatures are the camera temperature reported in
the camera's EXIF data and was 2 to 10 degrees higher than measured
ambient temperature. The more massive 1D cameras tended to have a
larger difference between internal camera and ambient temperature.
For example, the 7D points at -10 and -11 C where made side-by-side
with the 1DIV in a freezer and the 1D reported -3 and -5 C.
The freezer temperature was -13 C and the cameras cooled for 2 hours.
The upturn in the trend for the 6D and 1DX may be due to internal
heating and the sensor was actually warmer than the reported
temperature. Even so, we see a clear trend of increasing dark current
with increasing temperature. Dark current tends to double for about
every 5 to 6 degrees C.
The 1D Mark IV dark current as a function of temperature is shown in Figure 3.
In general the trend for all canon cameras is similar, but cameras
with larger pixels tend to have higher dark currents at the same
temperature. All cameras seem to show a relative dip in the
log-linear trend with relatively lower dark current between
freezing and room temperature (~0 to 20 C).
See comparisons of dark frames from many cameras at:
Digital Cameras and Long Exposure Times:
Noise and Dark Current Comparisons ../long-exposure-comparisons/
Conclusions
The Canon 1D Mark IV sensor sets new performance standards for its
time, including higher sensitivity per pixel (a combination of filter
transmittance times effective fill factor times quantum efficiency),
lower read noise, and lower fixed pattern noise. The low read noise
of the 1DIV has been eclipsed by that for the Canon 1DX. Hopefully the
new technology that went into this sensor will makes its way into other
cameras as well. That will enable a new era in performance, especially
for high ISO / low light photography.
The constant dark level with long exposure time indicates the
camera has on-sensor dark current suppression. This, however, does
not suppress noise from dark current. But it results in a uniformly
dark level that needs no post processing correction. No long exposure
dark frames are needed when making long exposures if recording raw.
The banding (fixed pattern) noise is very low. As of this writing, only
the 1DX shows comparable banding noise, with the Canon 7D very close,
but the Canon 6D is a significant improvement in fixed pattern noise.
These four cameras are a cut above other cameras in this regard.
The banding noise in the Canon 5DIII and older 5DII have worse banding
noise, for example.
Dynamic range is still limited to a little over 11-stops, apparently by downstream
electronics that must process the data extremely fast (at 10 frames per second; that is
over 160 megapixels/second). I would like to see a camera option that used a slow
16-bit A/D converter and low noise amplifiers to deliver data with the full capability
of the sensor, which is 15 stops. Even if it took 10 seconds to read out the sensor
(longer readout times are used in scientific applications), there are situations
where high dynamic range imaging would benefit.
Since this camera was announced in late 2009, it is still a top performer in its
class, from wildlife action, sports, to long exposure low light photography.
Only the new Canon 6D surpasses the 1D Mark IV for long exposure low light
photography. The 1DIV surpasses the 1DX because the 1DIV has lower pattern noise
and lower dark current
If you find the information on this site useful,
please support Clarkvision and make a donation (link below).
Appendix 1
                          Table A1:  ISO 100 Sensor Data and Analysis

Offset= 2047
Model gain = 4.2  e/DN
Model read noise = 22.2 electrons


          Observed  signal - offset
          --------------------------
            min      max     mean     2-img std    noise     S/N      signal       ISO   relative    S/N     S/N
    file   (DN)     (DN)     (DN)        (DN)       (DN)            (electrons)          exposure    model obs/model

 _73C5280 13236.00 13237.00 13236.30     0.70     sensor saturated
 _73C5281 13236.00 13237.00 13236.42     0.70     sensor saturated
 _73C5282  9838.00 10783.00 10255.89    70.23      49.66    206.51    42645.9      100  0.650000    206.4     1.00
 _73C5283  9813.00 10676.00 10256.78    70.23      49.66    206.53    42653.2      100  0.650000    206.4     1.00
 _73C5284  6164.00  6786.00  6479.05    57.55      40.69    159.21    25348.6      100  0.384616    163.5     0.97
 _73C5285  6158.00  6824.00  6531.78    57.55      40.69    160.51    25762.9      100  0.384616    164.2     0.97
 _73C5286  3776.00  4192.00  3979.53    45.36      32.08    124.06    15390.7      100  0.250000    127.4     0.97
 _73C5287  3794.00  4256.00  4031.59    45.36      32.08    125.68    15795.9      100  0.250000    128.3     0.97
 _73C5288  2327.00  2630.00  2467.75    35.54      25.13     98.20     9643.2      100  0.161290     99.5     0.99
 _73C5289  2281.00  2603.00  2434.49    35.54      25.13     96.88     9384.9      100  0.161290     98.8     0.99
 _73C5290  1424.00  1648.00  1538.85    28.08      19.85     77.51     6008.0      100  0.096154     77.5     1.00
 _73C5291  1432.00  1652.00  1536.87    28.08      19.85     77.41     5992.6      100  0.096154     77.4     1.00
 _73C5292   869.00  1028.00   951.19    22.34      15.80     60.22     3626.3      100  0.062500     59.6     1.01
 _73C5293   872.00  1032.00   953.63    22.34      15.80     60.37     3644.9      100  0.062500     59.7     1.01
 _73C5294   537.00   662.00   598.09    18.13      12.82     46.65     2176.5      100  0.040651     45.8     1.02
 _73C5295   531.00   661.00   594.71    18.13      12.82     46.39     2152.0      100  0.040651     45.7     1.02
 _73C5296   327.00   425.00   375.24    15.02      10.62     35.34     1248.7      100  0.024154     34.6     1.02
 _73C5297   324.00   418.00   374.13    15.02      10.62     35.23     1241.4      100  0.024154     34.6     1.02
 _73C5298   195.00   275.00   233.72    12.71       8.98     26.01      676.8      100  0.015625     25.6     1.02
 _73C5299   190.00   275.00   233.10    12.71       8.98     25.95      673.2      100  0.015625     25.5     1.02
 _73C5300   112.00   183.00   149.07    11.01       7.78     19.15      366.9      100  0.010122     18.7     1.02
 _73C5301   117.00   191.00   149.15    11.01       7.78     19.17      367.3      100  0.010122     18.7     1.02
 _73C5302    68.00   124.00    94.63     9.86       6.98     13.57      184.0      100  0.006024     13.3     1.02
 _73C5303    65.00   123.00    93.30     9.86       6.98     13.38      178.9      100  0.006024     13.2     1.03
 _73C5304    32.00    84.00    57.75     8.99       6.36      9.08       82.4      100  0.003906      8.9     1.02
 _73C5305    33.00    86.00    58.96     8.99       6.36      9.27       85.9      100  0.003906      9.1     1.00
 _73C5306    15.00    62.00    37.23     8.48       6.00      6.21       38.5      100  0.002533      6.1     1.01
 _73C5307    14.00    64.00    38.70     8.48       6.00      6.45       41.6      100  0.002533      6.3     0.98
 _73C5308     2.00    48.00    24.12     8.11       5.74      4.20       17.7      100  0.001506      4.2     1.01
 _73C5309     2.00    49.00    25.41     8.11       5.74      4.43       19.6      100  0.001506      4.4     0.96
 _73C5310   -13.00    38.00    13.91     7.86       5.56      2.50        6.3      100  0.000976      2.5     1.01
 _73C5311    -7.00    37.00    15.88     7.86       5.56      2.86        8.2      100  0.000976      2.8     0.89
 _73C5312   -13.00    35.00    10.27     7.69       5.44      1.89        3.6      100  0.000633      1.9     1.01
 _73C5313   -12.00    34.00     9.93     7.69       5.44      1.83        3.3      100  0.000633      1.8     1.05
 _73C5314   -17.00    28.00     5.67     7.64       5.40      1.05        1.1      100  0.000376      1.0     1.00
 _73C5315   -18.00    28.00     6.00     7.64       5.40      1.11        1.2      100  0.000376      1.1     0.95
 _73C5316   -20.00    27.00     4.58     7.60       5.37      0.85        0.7      100  0.000244      0.8     1.00
 _73C5317   -18.00    25.00     3.36     7.60       5.37      0.63        0.4      100  0.000244      0.6     1.36
 _73C5318   -19.00    26.00     2.60     7.55       5.34      0.49        0.2      100  0.000158      0.5     1.00
 _73C5319   -21.00    24.00     2.66     7.55       5.34      0.50        0.2      100  0.000158      0.5     0.98
 _73C5320   -21.00    24.00     1.36     7.55       5.34      0.26        0.1      100  0.000094      0.3     1.00
 _73C5321   -21.00    23.00     1.62     7.55       5.34      0.30        0.1      100  0.000094      0.3     0.84
 _73C5322   -25.00    24.00     1.27     7.52       5.32      0.24        0.1      100  0.000061      0.2     1.00
 _73C5323   -22.00    22.00     1.95     7.52       5.32      0.37        0.1      100  0.000061      0.4     0.65
                                 Table A2: Read Noise Data and Analysis

                                                                     Apparent
                                                                    Read Noise   Gain
    file     min     max     mean     2-img std    noise           (electrons)  (e/DN)    ISO
 _73C5408  2025.00  2068.00  2047.24     7.48       5.29               22.215    4.200    100
 _73C5409  2025.00  2068.00  2047.19     7.48       5.29               22.215    4.200    100
 _73C5412  2022.00  2074.00  2046.93     7.72       5.46               11.466    2.100    200
 _73C5413  2022.00  2068.00  2047.01     7.72       5.46               11.466    2.100    200
 _73C5416  2009.00  2087.00  2046.85     8.91       6.30                6.615    1.050    400
 _73C5417  2011.00  2103.00  2046.88     8.91       6.30                6.615    1.050    400
 _73C5422  1985.00  2127.00  2047.00    10.90       7.71                4.045    0.525    800
 _73C5423  1978.00  2106.00  2047.00    10.90       7.71                4.045    0.525    800
 _73C5428  1912.00  2197.00  2047.15    15.81      11.18                2.906    0.260    1600
 _73C5429  1942.00  2208.00  2047.06    15.81      11.18                2.906    0.260    1600
 _73C5434  1795.00  2330.00  2045.84    25.20      17.82                2.334    0.131    3200
 _73C5435  1796.00  2320.00  2046.29    25.20      17.82                2.334    0.131    3200
 _73C5440  1619.00  2553.00  2046.14    40.92      28.94                1.910    0.066    6400
 _73C5441  1520.00  2546.00  2046.15    40.92      28.94                1.910    0.066    6400
 _73C5446  1529.00  2583.00  2043.83    74.45      52.64                1.737    0.033    12800
 _73C5447  1487.00  2750.00  2043.78    74.45      52.64                1.737    0.033    12800


Data acquired by Peter A. Hawrylyshyn, M.D.  February, 2010.
Thermal dark current data by R. Clark, January, 2014.
Analysis by R. N. Clark February 13. 2010 - Jan. 2014.
References
1)
CCD Gain. http://spiff.rit.edu/classes/phys559/lectures/gain/gain.html
2)
Charge coupled CMOS and hybrid detector arrays
http://huhepl.harvard.edu/~LSST/general/Janesick_paper_2003.pdf
3)
Canon EOS 20D vs Canon EOS 10D and
Canon 10D / Canon 20D / Nikon D70 / Audine comparison
http://www.astrosurf.org/buil/20d/20dvs10d.htm
4)
http://www.photomet.com/library_enc_fwcapacity.shtml
5)
Astrophotography Signal-to-Noise with a Canon 10D Camera
http://clarkvision.com/astro/canon-10d-signal-to-noise
Notes:
DN is "Data Number." That is the number in the file for each
pixel. I'm quoting the luminance level (although red, green
and blue are almost the same in the cases I cited).
16-bit signed integer: -32768 to +32767
16-bit unsigned integer: 0 to 65535
Photoshop uses signed integers, but the 16-bit tiff is
unsigned integer (correctly read by ImagesPlus).
The sensor analysis was done with custom, in-house written software. Raw data were
extracted from the camera raw files using DCRAW. Custom software read
that data and all processing was done in 32-bit floating point.
http://clarkvision.com/reviews/evaluation-canon-1div
First published February 13, 2010.
Last updated January 19, 2014.