The Canon 1DX Digital Camera Review:
Sensor Noise, Thermal Noise, Dynamic Range, and Full Well Analysis
by Roger N. Clark
All images, text and data on this site are copyrighted.
They may not be used except by written permission from Roger N. Clark.
All rights reserved.
If you find the information on this site useful,
please support Clarkvision and make a donation (link below).
This page shows an analysis of noise, dynamic range, and full well capacity
of a Canon 1DX camera.
It also shows the dark current and noise from thermal
dark current as a function of temperature.
Procedures for performing this analysis are described in:
Procedures for Evaluating Digital Camera Noise, Dynamic Range, and Full
Well Capacities; Canon 1D Mark II Analysis
The lowest possible noise from a system detecting light is the noise due to Poisson
statistics from the random rate of the arrival of photons. This is called photon
statistics, or photon noise. Noise from the electronics will add to the photon noise.
Noise in Canon 1DX images is limited by photon statistics at high signal levels
and by electronic noise from reading the sensor (called readout noise) and
noise from the downstream electronics at very low signal levels. In the case of
high signal levels, a system that is photon statistics
limited enables us to directly measure how many photons the sensor captures, and by
increasing the exposure, we can determine how many photons are required to saturate
the sensor. That is called the full well capacity, or simply, maximum signal capacity.
With data on the lowest noise to the highest signal, we can then determine the dynamic
range of the sensor.
The data and analysis results below show how the canon 1DX sensor performs.
Table 1 shows the results and these results will be added to the graphs at
Digital Sensor Performance summary
for comparison with other cameras (for now you can plot the values yourself
from the data below).
The read noise, reaching a low of only 1.2 electrons at ISO 12,800 is the lowest
I have yet measured and the lowest I have seen on any room-temperature sensor.
Only the 1D Mark IV in the canon line comes close; all other Canon cameras tested
above 2 electrons read noise, except the Canon 1D Mark IV, which has a read noise at
ISO 12,800 of 1.7 electrons.
The data that were measured for this evaluation are presented in Appendix 1.
But even more impressive than the high signal and low read noise, is the
far better control of pattern noise. The 1DX sensor comes out just ahead
of the 1D Mark IV at ISOs above 1600, but at ISO 1600 and below, the 1DIV shows
less pattern noise. Note the Canon 7D shows less pattern noise
at ISOs below ISO 1600 than the 1DX. Pattern noise limits the detail
visible in shadows, and the ability to pull out low level detail or faint
signal. Pattern noise is particularly visible to the human eye+brain system.
              Table 1
-------------------------------------------------
               Apparent  Maximum     Measured
  ISO  Gain   Read Noise  signal    Dynamic range
       e/DN  (electrons) (electrons)   stops

    50  6.7      35.6     88600        11.3
   100  6.7      35.2     88600        11.3
   200  3.35     16.8     44300        11.4
   400  1.67      8.7     22100        11.3
   800  0.84      4.6     11000        11.2
  1600  0.42      2.7      5500        11.0
  3200  0.21      1.7      2770        10.7
  6400  0.105     1.4      1400         9.7
 12800  0.052     1.2       690         8.9
 25600  0.026     1.2       350         8.2
 51200  0.013     1.2       170         7.1
102400  0.0065    1.14       87         6.2
204800  0.0032    0.92       43         5.5

maximum DN: ISO  50 = 15283
            ISO 100 = 15283

Pixel pitch= 6.9 microns.
18.1 megapixels.
-------------------------------------------------
Derived Parameters:
S/N on 18% gray card, ISO 100 = 126.
S/N on 18% gray card, ISO 1600 = 31.5
Sensor Full Well Capacity at lowest ISO: 88,600 electrons.
Sensor dynamic range = 88600/1.2 = 73,800 = 16.2 stops.
(note: limit read noise to ISO that give at least 8 stops dynamic range)
ISO at unity gain (scaled to 12 bit) = 2680 (14-bit unity gain = ISO 670).
Pixel linear density = 144.9 pixels / mm
Pixel density = 21,004 pixels / square mm
Sensor maximum signal density at ISO 200 = 930 electrons / square micron
Sensor maximum signal density at ISO 1600 = 115.5 electrons / square micron
Sensor read noise density (best read noise) = 133 electrons / square mm
Sensor dynamic range density at ISO 1600 = 18.2 stops dynamic range / square mm
New Low Light sensitivity Factor: 42.8 (= sensor max signal density at ISO 1600 / read noise at ISO 1600)
Full Sensor Apparent Image Quality, FS-AIQ = 114
Focal Length Limited Apparent Image Quality, ISO 1600, Constant output Size, FLL-AIQ1600 = 119.7
Values in the above table are described at
Digital Sensor Performance summary.
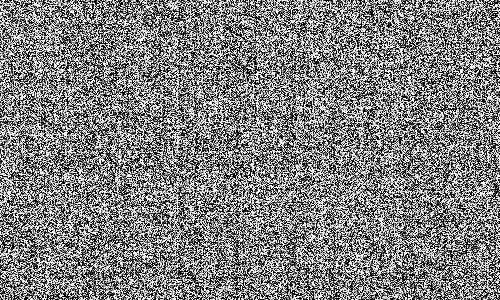
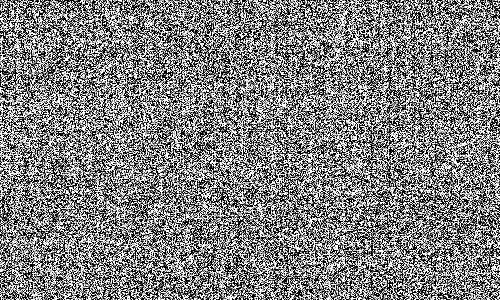
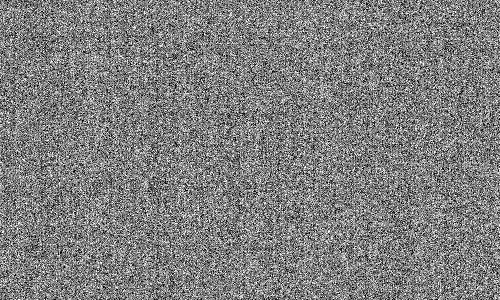
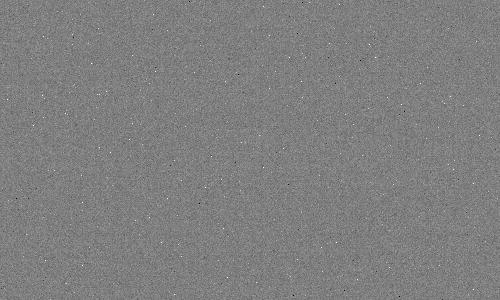
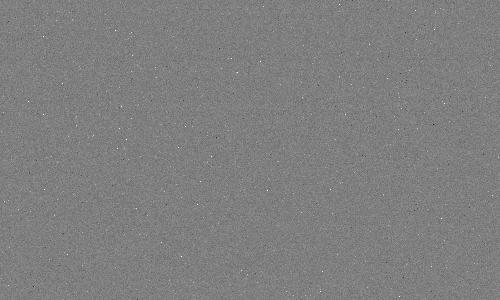
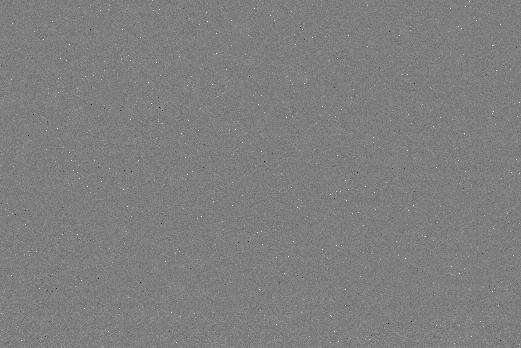
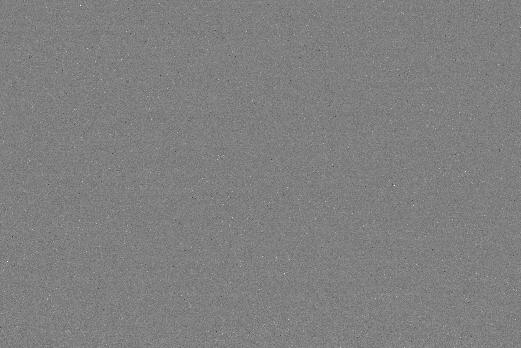
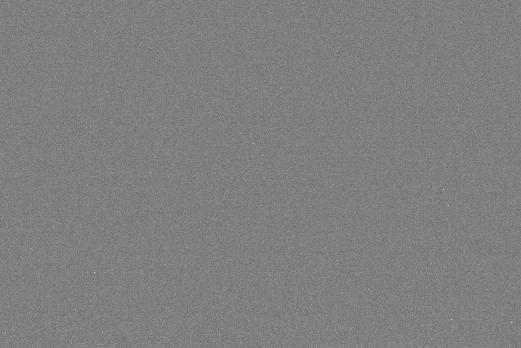
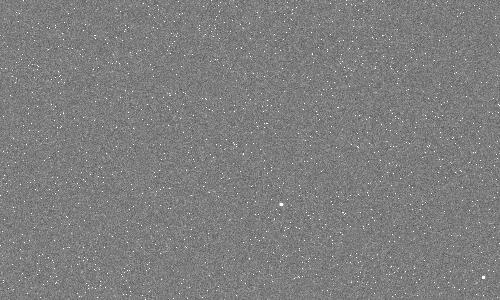
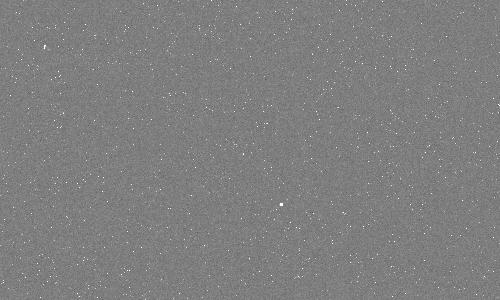
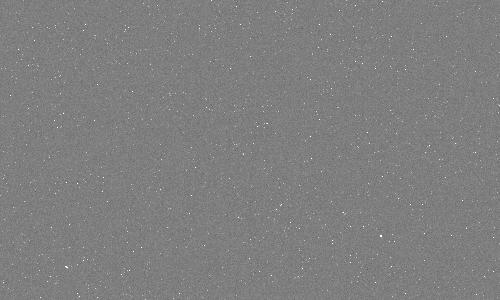
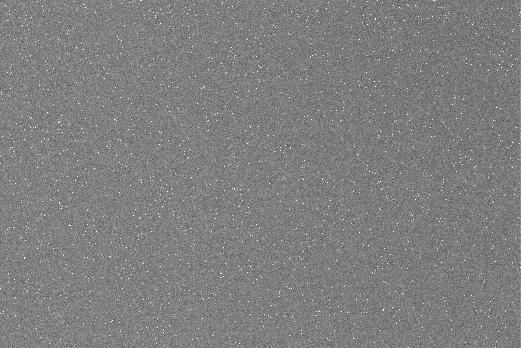
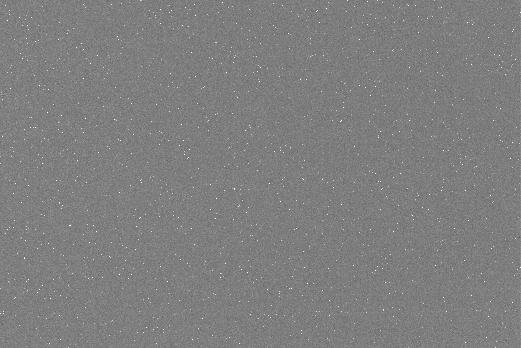
Pattern (Banding) Noise
Table 2 shows the noise as a function of ISO in image form. The images illustrate several
things: 1) lower banding noise at higher ISOs. 2) Better detection of smaller signals at
higher ISOs (the random noise decreases). 3) At a certain high ISO, improvements decrease,
meaning there is no benefit to higher ISO. Note, ISO is a post sensor gain and does
not increase sensitivity. Increasing ISO digitizes a smaller range (see Table 1) but does
improve the noise floor up to a point. These images are very close to those for the Canon 1D Mark IV and
significantly better than the Canon 5D Mark III.
| Table 2a. Apparent Read Noise, Central Image |
 | ISO 50
Image Range:
-20.00 to 20.00 electrons about the mean
Central 500 x 300 pixel statistics:
min= 13568 electrons
max= 13990 electrons
mean= 13723 electrons
standard deviation= 34.63 electrons |
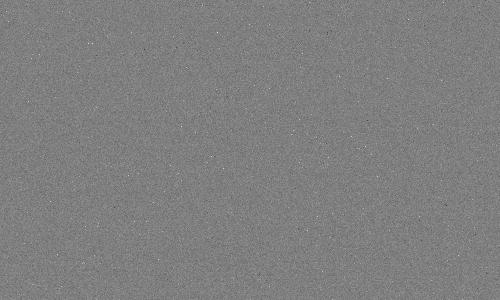
 | ISO 100
Image Range:
-20.00 to 20.00 electrons about the mean
Central 500 x 300 pixel statistics:
min= 13547 electrons
max= 13902 electrons
mean= 13723 electrons
standard deviation= 34.54 electrons |
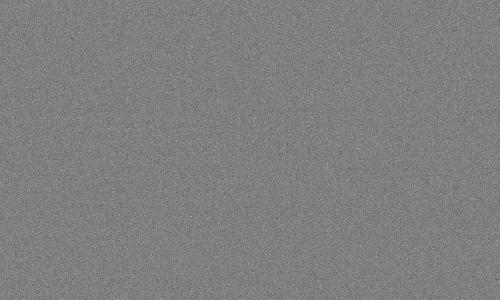
 | ISO 200
Image Range:
-20.00 to 20.00 electrons about the mean
Central 500 x 300 pixel statistics:
min= 6790 electrons
max= 7102 electrons
mean= 6859 electrons
standard deviation= 16.62 electrons |
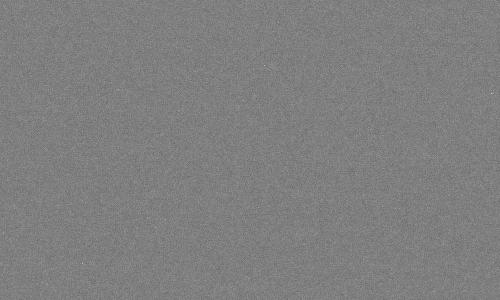
 | ISO 400
Image Range:
-20.00 to 20.00 electrons about the mean
Central 500 x 300 pixel statistics:
min= 3365 electrons
max= 3619 electrons
mean= 3421 electrons
standard deviation= 8.55 electrons |
 | ISO 800
Image Range:
-20.00 to 20.00 electrons about the mean
Central 500 x 300 pixel statistics:
min= 1685 electrons
max= 1949 electrons
mean= 1720 electrons
standard deviation= 4.58 electrons |
 | ISO 1600
Image Range:
-20.00 to 20.00 electrons about the mean
Central 500 x 300 pixel statistics:
min= 824 electrons
max= 975 electrons
mean= 860 electrons
standard deviation= 2.62 electrons |
 | ISO 3200
Image Range:
-20.00 to 20.00 electrons about the mean
Central 500 x 300 pixel statistics:
min= 399 electrons
max= 524 electrons
mean= 430 electrons
standard deviation= 1.76 electrons |
 | ISO 6400
Image Range:
-20.00 to 20.00 electrons about the mean
Central 500 x 300 pixel statistics:
min= 183 electrons
max= 249 electrons
mean= 215 electrons
standard deviation= 1.52 electrons |
 | ISO 12800
Image Range:
-20.00 to 20.00 electrons about the mean
Central 500 x 300 pixel statistics:
min= 78 electrons
max= 148 electrons
mean= 106 electrons
standard deviation= 1.31 electrons |
 | ISO 25600
Image Range:
-20.00 to 20.00 electrons about the mean
Central 500 x 300 pixel statistics:
min= 35 electrons
max= 79 electrons
mean= 53 electrons
standard deviation= 1.31 electrons |
 | ISO 51200
Image Range:
-20.00 to 20.00 electrons about the mean
Central 500 x 300 pixel statistics:
min= 15 electrons
max= 43 electrons
mean= 27 electrons
standard deviation= 1.28 electrons |
 | ISO 102400
Image Range:
-20.00 to 20.00 electrons about the mean
Central 500 x 300 pixel statistics:
min= 8 electrons
max= 25 electrons
mean= 14 electrons
standard deviation= 1.31 electrons |
 | ISO 204800
Image Range:
-20.00 to 20.00 electrons about the mean
Central 500 x 300 pixel statistics:
min= 2 electrons
max= 19 electrons
mean= 6 electrons
standard deviation= 1.03 electrons |
| Table 2b. Apparent Read Noise, Full Image, sub-sampled |
 | ISO 50
Image Range:
-20.00 to 20.00 electrons about the mean
Full image statistics:
min= 13507 electrons
max= 14090 electrons
mean= 13723 electrons
standard deviation= 34.43 electrons |
 | ISO 100
Image Range:
-20.00 to 20.00 electrons about the mean
Full image statistics:
min= 13494 electrons
max= 14010 electrons
mean= 13723 electrons
standard deviation= 34.37 electrons |
 | ISO 200
Image Range:
-20.00 to 20.00 electrons about the mean
Full image statistics:
min= 6770 electrons
max= 7202 electrons
mean= 6859 electrons
standard deviation= 16.57 electrons |
 | ISO 400
Image Range:
-20.00 to 20.00 electrons about the mean
Full image statistics:
min= 3352 electrons
max= 3776 electrons
mean= 3420 electrons
standard deviation= 8.50 electrons |
 | ISO 800
Image Range:
-20.00 to 20.00 electrons about the mean
Full image statistics:
min= 1667 electrons
max= 2077 electrons
mean= 1720 electrons
standard deviation= 4.53 electrons |
 | ISO 1600
Image Range:
-20.00 to 20.00 electrons about the mean
Full image statistics:
min= 805 electrons
max= 1224 electrons
mean= 860 electrons
standard deviation= 2.60 electrons |
 | ISO 3200
Image Range:
-20.00 to 20.00 electrons about the mean
Full image statistics:
min= 378 electrons
max= 777 electrons
mean= 430 electrons
standard deviation= 1.76 electrons |
 | ISO 6400
Image Range:
-20.00 to 20.00 electrons about the mean
Full image statistics:
min= 173 electrons
max= 311 electrons
mean= 215 electrons
standard deviation= 1.53 electrons |
 | ISO 12800
Image Range:
-20.00 to 20.00 electrons about the mean
Full image statistics:
min= 63 electrons
max= 152 electrons
mean= 107 electrons
standard deviation= 1.34 electrons |
 | ISO 25600
Image Range:
-20.00 to 20.00 electrons about the mean
Full image statistics:
min= 30 electrons
max= 87 electrons
mean= 53 electrons
standard deviation= 1.35 electrons |
 | ISO 51200
Image Range:
-20.00 to 20.00 electrons about the mean
Full image statistics:
min= 11 electrons
max= 54 electrons
mean= 27 electrons
standard deviation= 1.31 electrons |
 | ISO 102400
Image Range:
-20.00 to 20.00 electrons about the mean
Full image statistics:
min= 1 electrons
max= 37 electrons
mean= 14 electrons
standard deviation= 1.33 electrons |
 | ISO 204800
Image Range:
-20.00 to 20.00 electrons about the mean
Full image statistics:
min= 0 electrons
max= 48 electrons
mean= 6 electrons
standard deviation= 1.06 electrons |
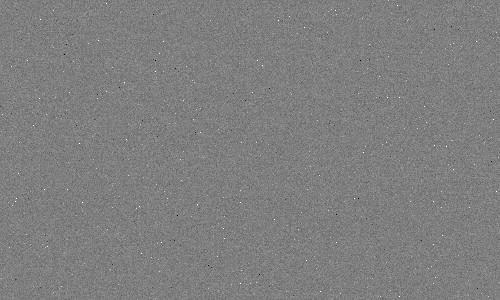
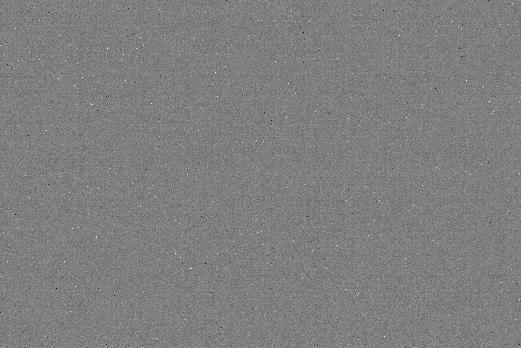
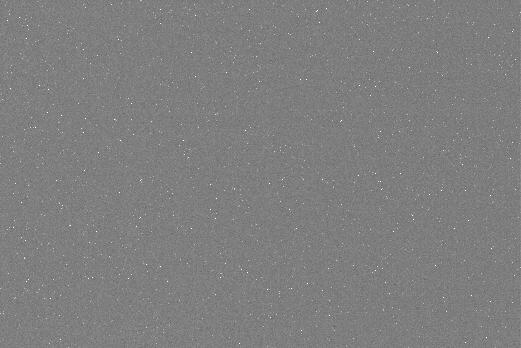
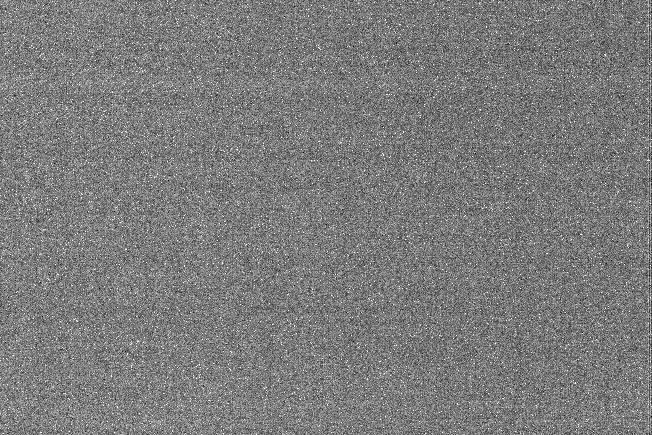
Dark Current and Thermal Noise
On long exposures, electrons collect in the sensor due to thermal
processes. This is called the thermal dark current. As with photon noise,
the noise from thermal dark current is the square root of the
signal. One can subtract the dark current level, but not the noise
from the dark current. Many modern digital cameras have on sensor
dark current suppression, but this does not suppress the noise
from the dark current. It does, however, prevent uneven
zero levels that plagues cameras made before the innovation (Canon
cameras before circa 2008). Examples of this problem are seen
at:
Long-Exposure Comparisons.
The derived dark current is shown in Table 3 and images from the dark frames
are shown in Tables 4a, 4b, and 4c.
Depending on temperature and exposure time thermal noise can swamp read
noise. The data in Table 3 show that after only a few seconds, thermal
noise is above high ISO read noise, and is another reason to not raise
ISO above about 1600 in night/low light photography when exposure times are
longer than about 2 seconds. Only when exposure times are shorter than
about 2 seconds around the temperatures in Table 3, will thermal noise
be comparable to or less than high ISO apparent read noise.
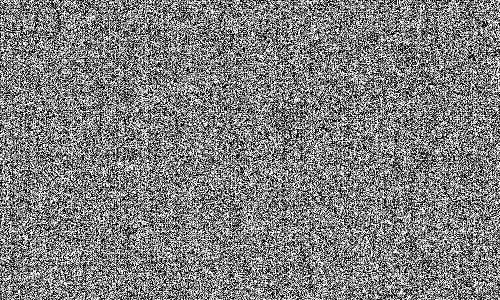
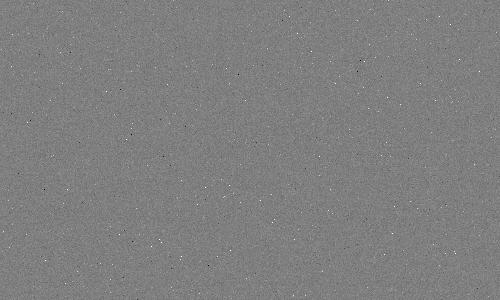
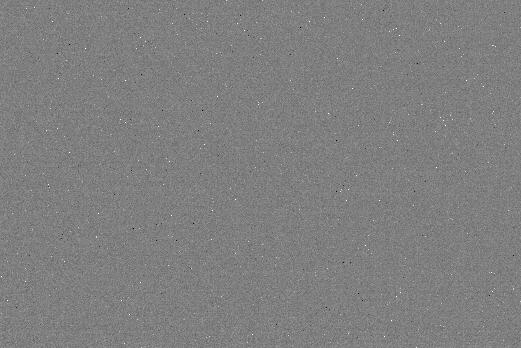
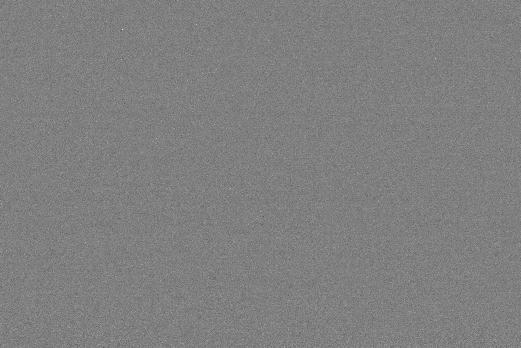
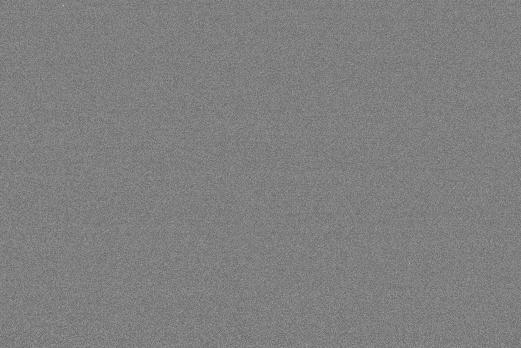
The uniformity of the 1DX long exposure dark frames, Tables 4a, 4b,
is very good. However, when we lool close, as in Table 4c, we do see some
faint banding. The low level banding will not impact some frames averaged, but
may be a limiting factor for extremely deep imaging typical in
nightscapes and astrophotography.
Thermal noise ultimately limits the weakest
signals that can be detected.
Thermal dark current is very temperature dependent, so only
compare these values to other sensors made at the same temperature.
The dark current increased 2.5 times from 7 to 13 C, so doubles about
every 7.5 degrees C in the 1DX in the freezing to room temperature
range. Note too that the lower the temperature, the fewer hot pixels
show in the image. The internal camera temperature runs several degrees warmer
than ambient.
                              Table 3
                Canon 1DX Dark Current vs Temperature

                                     Noise from Dark Current in Electrons
 Temperature   Dark current            versus  Exposure Time (seconds)
  (C)   (F)   electrons/sec.    10 sec    30 sec    60 sec    120 sec    300 sec

   13    55     1.843             4.3       7.4      10.5      14.9       23.5
    7    45     0.728             2.7       4.7       6.6       9.3       14.8
    3    37     0.648             2.5       4.4       6.2       8.8       13.9
| Table 4a. Thermal Noise, Central Image |
 |
ISO 1600
Exposure= 600 seconds
T= 13 C
Image Range:
-100.00 to 100.00 electrons about the mean
Central 500 x 300 pixel statistics:
min= 812 electrons
max= 5958 electrons
mean= 861 electrons
standard deviation= 33.36 electrons |
 |
ISO 1600
Exposure= 600 seconds
T= 7 C
Image Range:
-100.00 to 100.00 electrons about the mean
Central 500 x 300 pixel statistics:
min= 821 electrons
max= 5957 electrons
mean= 861 electrons
standard deviation= 21.07 electrons |
 |
ISO 1600
Exposure= 600 seconds
T= 3 C
Image Range:
-100.00 to 100.00 electrons about the mean
Central 500 x 300 pixel statistics:
min= 817 electrons
max= 5958 electrons
mean= 861 electrons
standard deviation= 19.89 electrons |
| Table 4b. Thermal Noise, Full Image, sub-sampled |
 |
ISO 1600
Exposure= 600 seconds
T= 13 C
Image Range:
-100.00 to 100.00 electrons about the mean
Full image statistics:
min= 781 electrons
max= 5958 electrons
mean= 860 electrons
standard deviation= 25.09 electrons |
 |
ISO 1600
Exposure= 600 seconds
T= 7 C
Image Range:
-100.00 to 100.00 electrons about the mean
Full image statistics:
min= 804 electrons
max= 5958 electrons
mean= 861 electrons
standard deviation= 18.44 electrons |
 |
ISO 1600
Exposure= 600 seconds
T= 3 C
Image Range:
-100.00 to 100.00 electrons about the mean
Full image statistics:
min= 803 electrons
max= 5958 electrons
mean= 861 electrons
standard deviation= 17.38 electrons |
| Table 4c. Thermal Noise, Full Image, sub-sampled |
 |
ISO 1600
Exposure= 600 seconds
T= 3 C
Image Range:
-20.00 to 20.00 electrons about the mean
Full image statistics:
min= 803 electrons
max= 5958 electrons
mean= 861 electrons
standard deviation= 17.38 electrons |
See comparisons of dark frames from many cameras at:
Digital Cameras and Long Exposure Times:
Noise and Dark Current Comparisons ../long-exposure-comparisons/
Figure 1. Dark current as a function of temperature for 5 cameras
are compared. The temperatures are the camera temperature reported in
the camera's EXIF data and was 2 to 10 degrees higher than measured
ambient temperature. The more massive 1D cameras tended to have a
larger difference between internal camera and ambient temperature.
For example, the 7D points at -10 and -11 C where made side-by-side
with the 1DIV in a freezer and the 1D reported -3 and -5 C.
The freezer temperature was -13 C and the cameras cooled for 2 hours.
The upturn in the trend for the 6D and 1DX may be due to internal
heating and the sensor was actually warmer than the reported
temperature. Even so, we see a clear trend of increasing dark current
with increasing temperature. Dark current tends to double for about
every 5 to 6 degrees C.
The 1DX dark current as a function of temperature is shown in Figure 1.
The comparison shows that the 1DX has higher dark current than the
1D Mark IV, 7D and 6D, but less than that for the 1D Mark II.
Some of this effect is pixel size. Given the same technology, larger
pixels will have larger dark current.
In general the trend for all canon cameras is similar, but cameras
with larger pixels tend to have higher dark currents at the same
temperature. All cameras seem to show a relative dip in the
log-linear trend with relatively lower dark current between
freezing and room temperature (~0 to 20 C).
Conclusions
The Canon 1DX sensor has impressive performance, from lowest measured
read noise of all the sensor analyses completed here, and good high signal
response, making this camera a top performer. Banding noise tracks with
ISO almost identically with that for the Canon 1D Mark IV, making these
two cameras a good choice for high ISO low light work. However, the
1DX has higher dark current, and this more noise at the low end than the 1DIV, 7D or 6D.
But note in long exposures, where thermal noise domiates the low
end, the 1DX shows some low level banding. The 1DIV does not show this problem,
though it does show a weak gradient.
At very high ISOs (above ISO 3200), the banding noise and read noise in the 1DX
is substantially lower than other cammeras measured on this site, making this camera
tops for low light fast exposure times (where thermal noise does not
affect the images, e.g. faster than about a second). This would be ideal
for very low light action, ranging from dimly lit rooms, to wildlife
action in twilight.
The constant dark level with long exposure time indicates the
camera has on-sensor dark current suppression. This, however, does
not suppress noise from dark current. But it results in a uniformly
dark level that needs no post processing correction. No long exposure
dark frames are needed when making long exposures if recording raw.
Acknowledgements. A special thanks to Colin Knight for the main data
acquisition and to Charlie Summers for the thermal dark current data.
If you find the information on this site useful,
please support Clarkvision and make a donation (link below).
Appendix 1
                          Appendix 1, Table A1:  ISO 100 Sensor Data and Analysis

Offset= 2048
Model gain = 6.7  e/DN
Model read noise = 35.2 electrons

          Observed  signal - offset
          --------------------------
            min-o   max-o   mean-o   2-img std    noise     S/N      signal      gain     ISO  relative    S/N     S/N        image
    file    (DN)    (DN)    (DN)       (DN)       (DN)            (electrons)   (e/DN)         exposure    model obs/model   std dev
CO4Q6768 12673.00 13235.00 12989.00    61.84      43.73    297.06    88242.4    6.794     100  0.588235    292.9     1.01    82.48
CO4Q6769 12712.00 13235.00 13048.99    61.84      43.73    298.43    89059.5    6.825     100  0.588235    293.6     1.01    82.56
CO4Q6770  9982.00 10481.00 10223.10    55.21      39.04    261.88    68583.7    6.709     100  0.500000    259.4     1.01    68.40
CO4Q6771 10042.00 10557.00 10293.88    55.21      39.04    263.70    69536.5    6.755     100  0.500000    260.3     1.01    68.84
CO4Q6772  7862.00  8314.00  8091.91    49.12      34.73    232.97    54277.1    6.708     100  0.384615    230.2     1.01    56.81
CO4Q6773  7899.00  8335.00  8107.84    49.12      34.73    233.43    54491.0    6.721     100  0.384615    230.5     1.01    57.04
CO4Q6774  6224.00  6763.00  6399.71    43.40      30.69    208.54    43487.5    6.795     100  0.322581    204.1     1.02    47.56
CO4Q6775  6200.00  6707.00  6396.97    43.40      30.69    208.45    43450.2    6.792     100  0.322581    204.1     1.02    47.37
CO4Q6776  4903.00  5347.00  5053.39    38.57      27.27    185.28    34327.4    6.793     100  0.250000    180.7     1.03    39.75
CO4Q6777  4885.00  5289.00  5046.52    38.57      27.27    185.02    34234.1    6.784     100  0.250000    180.6     1.03    39.55
CO4Q6778  3857.00  4181.00  3988.81    34.02      24.05    165.82    27497.1    6.894     100  0.192308    159.8     1.04    33.36
CO4Q6779  3862.00  4168.00  4000.31    34.02      24.05    166.30    27655.9    6.913     100  0.192308    160.1     1.04    33.58
CO4Q6780  3031.00  3297.00  3157.22    30.39      21.49    146.94    21591.0    6.839     100  0.161290    141.4     1.04    28.35
CO4Q6781  3039.00  3299.00  3152.38    30.39      21.49    146.71    21524.9    6.828     100  0.161290    141.2     1.04    28.35
CO4Q6782  2396.00  2635.00  2488.75    27.18      19.22    129.48    16764.7    6.736     100  0.125000    124.6     1.04    24.37
CO4Q6783  2411.00  2651.00  2501.76    27.18      19.22    130.16    16940.5    6.771     100  0.125000    124.9     1.04    24.36
CO4Q6784  1879.00  2093.00  1964.29    24.30      17.18    114.33    13070.4    6.654     100  0.096154    109.7     1.04    20.98
CO4Q6785  1893.00  2068.00  1972.83    24.30      17.18    114.82    13184.4    6.683     100  0.096154    109.9     1.04    20.90
                        Appendix 1, Table A2: Read Noise Data and Analysis

                                                                     Apparent
                                                                    Read Noise   Gain
    file     min     max     mean     2-img std    noise           (electrons)  (e/DN)    ISO

 CO4Q6817   -21.00    61.00     0.01     7.52       5.32               35.647    6.700    50
 CO4Q6818   -21.00    40.00     0.13     7.52       5.32               35.647    6.700    50
 CO4Q6819   -23.00    53.00     0.20     7.44       5.26               35.262    6.700    100
 CO4Q6820   -25.00    27.00     0.18     7.44       5.26               35.262    6.700    100
 CO4Q6821   -23.00   128.00     0.11     7.11       5.02               16.832    3.350    200
 CO4Q6822   -21.00    72.00    -0.61     7.11       5.02               16.832    3.350    200
 CO4Q6823   -22.00   243.00     0.20     7.35       5.20                8.681    1.670    400
 CO4Q6824   -22.00   119.00     0.22     7.35       5.20                8.681    1.670    400
 CO4Q6825   -34.00   494.00     0.16     7.83       5.53                4.649    0.840    800
 CO4Q6826   -39.00   272.00    -0.12     7.83       5.53                4.649    0.840    800
 CO4Q6827   -52.00   926.00     0.19     9.22       6.52                2.740    0.420    1600
 CO4Q6828   -71.00   274.00     0.08     9.22       6.52                2.740    0.420    1600
 CO4Q6830   -91.00  1065.00    -0.05    11.57       8.18                1.718    0.210    3200
 CO4Q6831   -93.00   447.00     0.04    11.57       8.18                1.718    0.210    3200
 CO4Q6832  -154.00   298.00     0.23    18.78      13.28                1.394    0.105    6400
 CO4Q6833  -195.00   323.00     0.35    18.78      13.28                1.394    0.105    6400
 CO4Q6834  -546.00   657.00     0.33    32.54      23.01                1.196    0.052    12800
 CO4Q6835  -496.00   567.00     0.15    32.54      23.01                1.196    0.052    12800
 CO4Q6836  -769.00   937.00     0.26    67.15      47.48                1.235    0.026    25600
 CO4Q6837  -685.00   858.00     0.48    67.15      47.48                1.235    0.026    25600
 CO4Q6838  -858.00  1422.00    -0.91   129.10      91.28                1.187    0.013    51200
 CO4Q6839  -771.00  1239.00    -0.38   129.10      91.28                1.187    0.013    51200
 CO4Q6840  -980.00  1314.00    -3.77   248.82     175.94                1.144    0.007    102400
 CO4Q6841 -1018.00  1451.00    -2.64   248.82     175.94                1.144    0.007    102400
 CO4Q6840  -980.00  1314.00    -3.77   400.94     283.51                0.921    0.003    204800
 CO4Q6842 -1378.00  2133.00    -1.38   400.94     283.51                0.921    0.003    204800

Data acquired by Colin Knight, October 2012.
Thermal dark Current data obtained by Charlie Summers, January, 2014.
Analysis by R. N. Clark November 2012, January 2014
References
1)
CCD Gain. http://spiff.rit.edu/classes/phys559/lectures/gain/gain.html
2)
Charge coupled CMOS and hybrid detector arrays
http://huhepl.harvard.edu/~LSST/general/Janesick_paper_2003.pdf
3)
Canon EOS 20D vs Canon EOS 10D and
Canon 10D / Canon 20D / Nikon D70 / Audine comparison
http://www.astrosurf.org/buil/20d/20dvs10d.htm
4)
http://www.photomet.com/library_enc_fwcapacity.shtml
5)
Astrophotography Signal-to-Noise with a Canon 10D Camera
http://clarkvision.com/astro/canon-10d-signal-to-noise
Notes:
DN is "Data Number." That is the number in the file for each
pixel. I'm quoting the luminance level (although red, green
and blue are almost the same in the cases I cited).
16-bit signed integer: -32768 to +32767
16-bit unsigned integer: 0 to 65535
Photoshop uses signed integers, but the 16-bit tiff is
unsigned integer (correctly read by ImagesPlus).
The sensor analysis was done with custom, in-house written software. Raw data were
extracted from the camera raw files using DCRAW. Custom software read
that data and all processing was done in 32-bit floating point.
Back to:
Digital Camera Sensor Analysis pages on this site:
http://clarkvision.com/articles/index.html#sensor_analysis
http://clarkvision.com/reviews/evaluation-canon-1div
First published November 4, 2012.
Last updated January 19, 2014.