Surface Brightness of Deep-Sky Objects
Measured with a Digital Camera
![]()
Surface Brightness of Deep-Sky Objects
Measured with a Digital Camera
The Surface Brightness distribution of an object determines its contrast and visibility as well as the exposure times needed by a camera to record it on film or an electronic sensor. Modern digital cameras have a good linear response and can be used for photometry. However, their response curves for the red, green, and blue sensors are different than the traditional B and V systems that astronomers use. However, this could be an advantage for recording truer color and predicting what the eye can see. On this page I show some of my first results in deriving surface brightnesses. In the coming months, I'll add more details on methods. I have independently derived the response curves of my camera (a Canon 10D) and will present that data in the future as well as equations for deriving surface brightness.
The basic concept to deriving surface brightness is to measure at least one standard star (ideally multiple stars as a function of airmass and deriving the extinction corrections needed). By measuring the total light from the standard star in red, green and blue pixels, one can convert the signal to stellar magnitudes. For measuring a star's total signal, I sum the data values in each pixel (DN) in increasing radius (or box) until the sky background is reached. Sky is measured away from the star with the same size aperture and the sky signal is subtracted from the star. From the known magnitudes of the star, you then can compute the DN's for that star's magnitude in red, green and blue. The primary standard I used is Alpha Lyra, defined as magnitude 0 in each filter.
To measure surface brightness, one needs to know the pixel size. Assuming one used the same optics for the standard and the object being measured, then the plate scale (arc-seconds per pixel) gives the angular pixel size, and therefore the intensity per square arc-second. One need not know the pixel fill factor as it cancels out via the standard star measurement, if the standard star was smeared over several pixels.
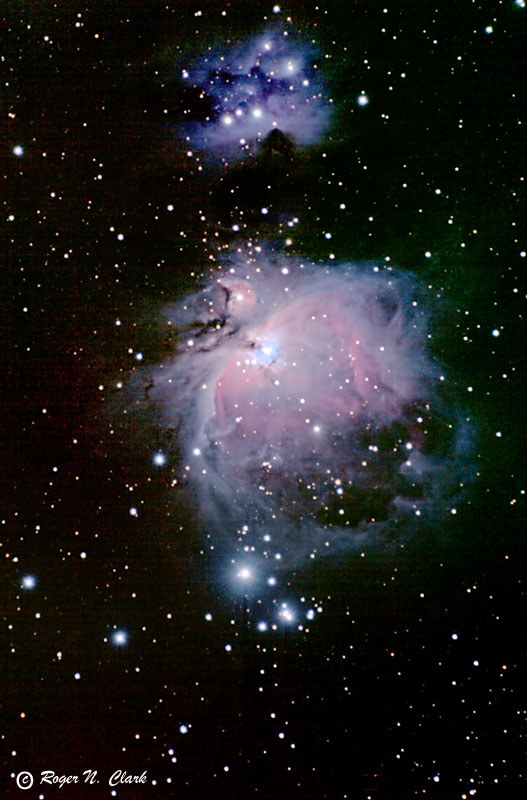
The first measurements presented are for the Great Orion Nebula, M42. Below is a 44 minute exposure. Camera: Canon 10D 6-MPixel digital camera, set at ISO 400. Lens was a 5-inch aperture, 500 mm focal length F/4 (Canon's 500 mm f/4 IS L telephoto lens) plus 1.4x teleconverter giving 700 mm at f/5.6. Data were recorded in raw mode, 1 minute exposures, and 44 exposures were added in ImagesPlus. Raw mode image falloff was characterized and removed from the images to give a uniform response across the full frame. Raw mode dark frames were also averaged and subtracted. Contrast stretch in ImagesPlus using digital development and in photoshop using LAB mode luminance channel only in 16-bits. Lab mode luminance channel operations preserved color in stars and the brightest portion of the nebula. Unsharp mask on luminance channel and Levels adjustments in photoshop. The sky was several times brighter than most of the nebula, about 16.8 in red, 17.5 in green, and 17.9 in blue. The brighter red sky is due to sodium street light contamination. Subtracting the sky reveals the nebula and allows surface brightness to be measured to very low levels, to approximately 22 magnitudes/ sq. arc-second. Below 22 magnitudes/sq. arc-second, uncertainties in level as well as noise rises. If the imaging was done from darker sites, photometry to lower levels is possible.
M42 surface brightness profile:
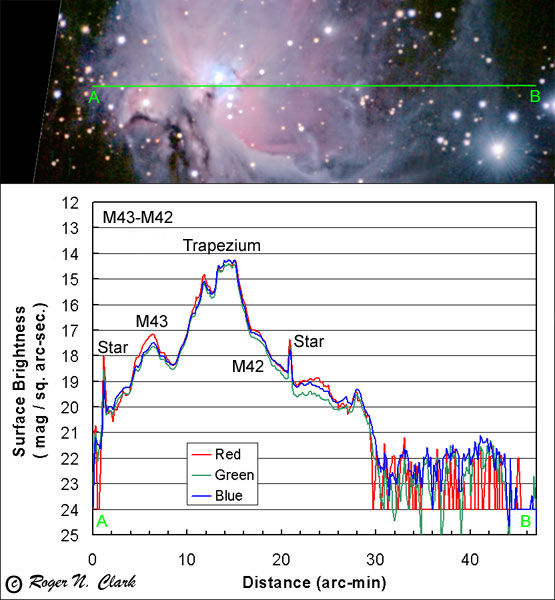
The above plot shows a surface brightness profile through a portion of M43, the trapezium, out to the faint outer loop of M42. The faint outer loop has a surface brightness of only about 21.3 magnitudes/sq. arc-sec. in blue, similar in green, and fainter in red.
NGC 1973-6-7 surface brightness profile:

A surface brightness profile for the nebula NGC 1973-6-7 in the sword of Orion shows a blue nebula that, while faint, is not as faint as the outer loop of M42.
M51.
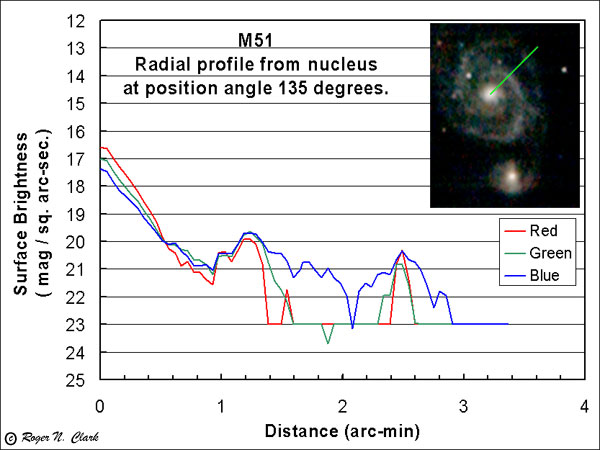
Surface brightness profile for M51. Compare these profiles to that in "Visual Astronomy of the Deep Sky." The blue + green signal is close to the eye's scotopic magnitude.
Last Updated March 28, 2004