ClarkVision.com
| Home | Galleries | Articles | Reviews | Best Gear | Science | New | About | Contact |
Terrestrial Volcanoes and the Color of Lava
by Roger N. Clark
| Home | Galleries | Articles | Reviews | Best Gear | Science | New | About | Contact |
by Roger N. Clark
What is the real color of lava? Online we see images with lava showing as red, orange, yellow and white. There are web sites that claim that hotter lava is yellow and white. But that is not true! In this article I will show the natural color of lava as a function of temperature and what causes the yellow and white lava in images. It is simple: overexposure in the camera saturating the color channels, with red saturating first, artificially creating yellow and in the extreme overexposure, white. All terrestrial lava is red, or if at the higher end of the temperature range, red-orange.
Contents
Introduction
Black Body Thermal Emission
What is White?
Why do we see Yellow and White in Photos of Lava?
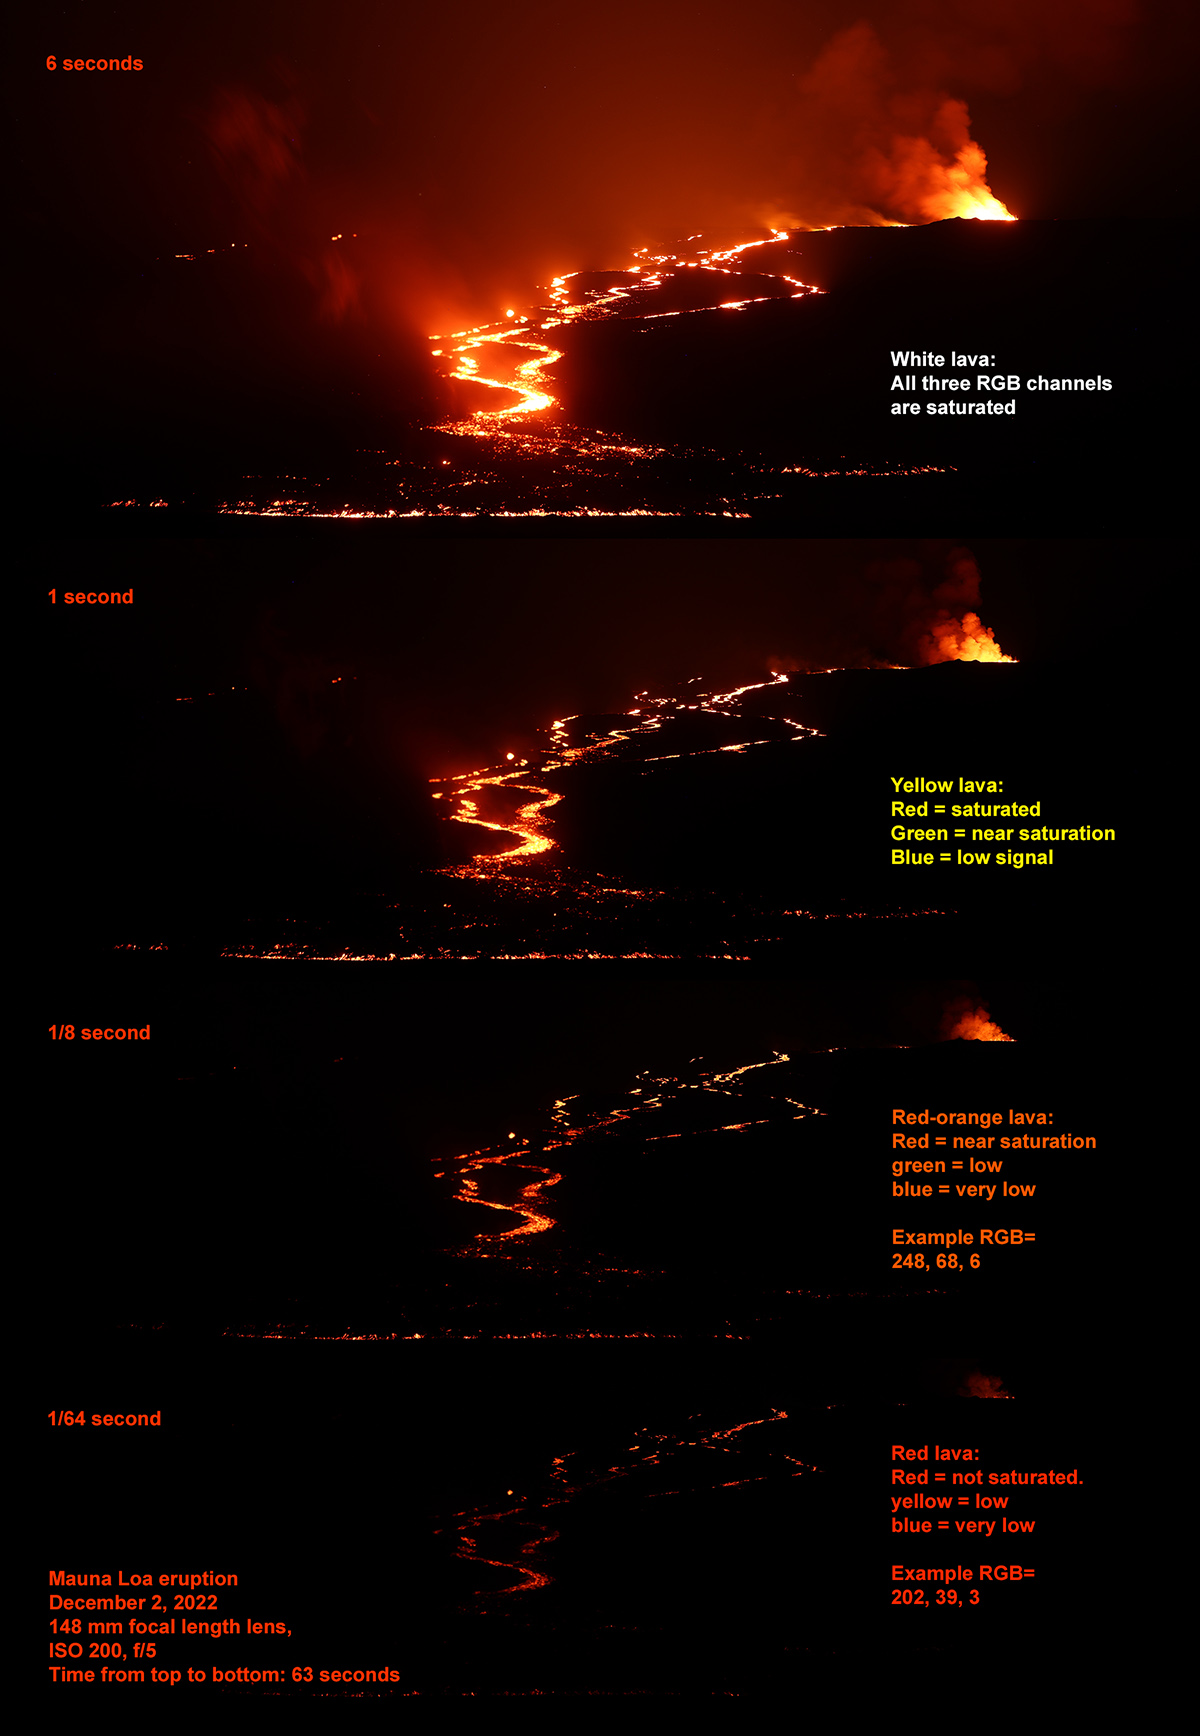
Mauna Loa Example
Mitigations to the Image Saturation Problem
Conclusions
What is the natural color of molten lava? On the internet and in scientific articles, I read that the color varies from red at lower temperatures to orange, yellow and white. But those color are not real. In this article I will show you why, both from correct photography as well as basic physics.
Here is a typical set of incorrect colors, this set is from the Encyclopedia of Volcanoes, 2000, Academic Press, in the chapter by Kilburn, in a Table on page 294:
Table 1 (INCORRECT COLORS OF LAVA)
-------------------------------------------------
     Temperature       Encyclopedia of Volcanoes
Centigrade  (Kelvin)    Color of lava surface
  1150       (1423)       White
  1090       (1363)       Golden yellow
   900       (1173)       Orange
   700        (973)       Bright cherry red
   600        (873)       Dull red
   475        (748)       Lowest visible red
-------------------------------------------------
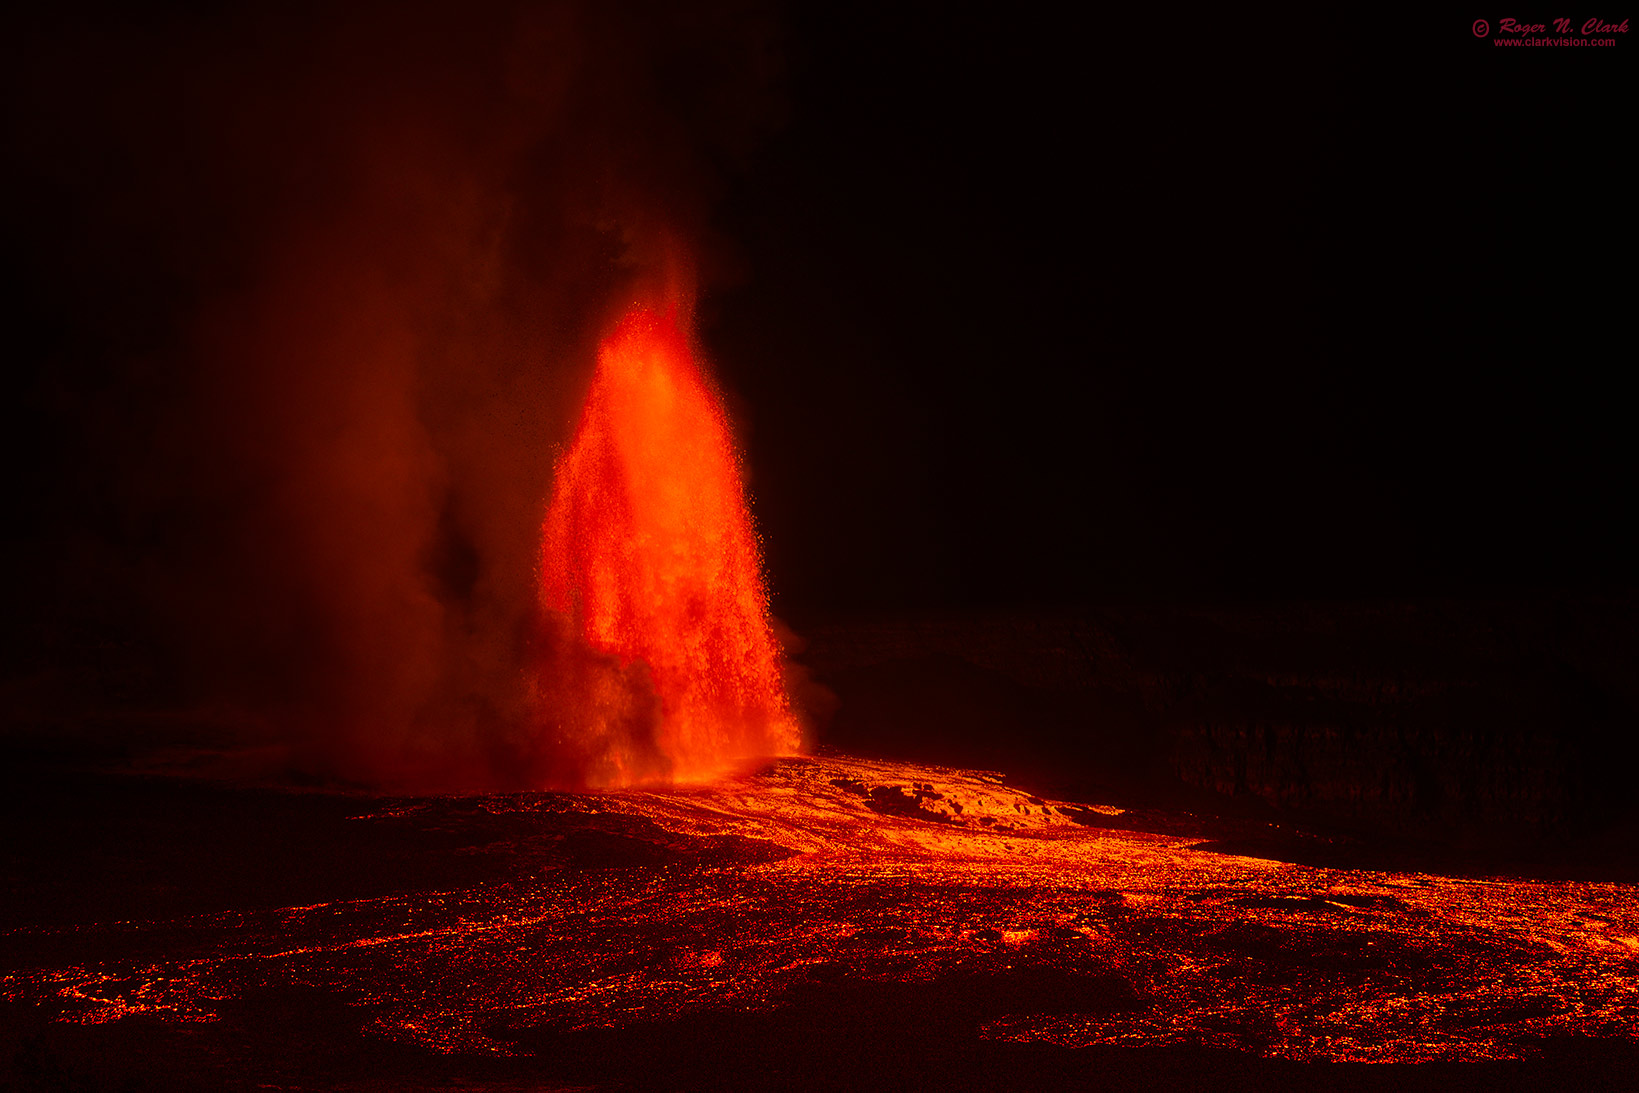
But look at the exposure sequence in Figure 1 where we see all the above colors from fountain eruption in Kilauea Caldera in April 2026 (eruption Episode 45). If the same source shows all the colors in Table 1 just by changing the exposure, what is the real color of the lava?
Another web page from the U. S. Geological Survey, updated March 27, 2026 states "Yellow indicates a temperature of about 1,000 - 1,200 degrees Celsius (1,832 - 2,192 degrees Fahrenheit)." So what temperature is the lava in Figure 1, where color varies from white to red depending on camera exposure?
The hottest lava on Earth is Mafic (Basaltic) Lava: 1,000°C to 1,200°C (1,830°F to 2,200°F). Ball, 2024, How Hot Hot when it comes to Volcanoes? California Volcano Observatory. This is the type of lava coming out of Hawaiian volcanoes, including the lava in Figure 1, a Kilauea, Hawaii eruption.
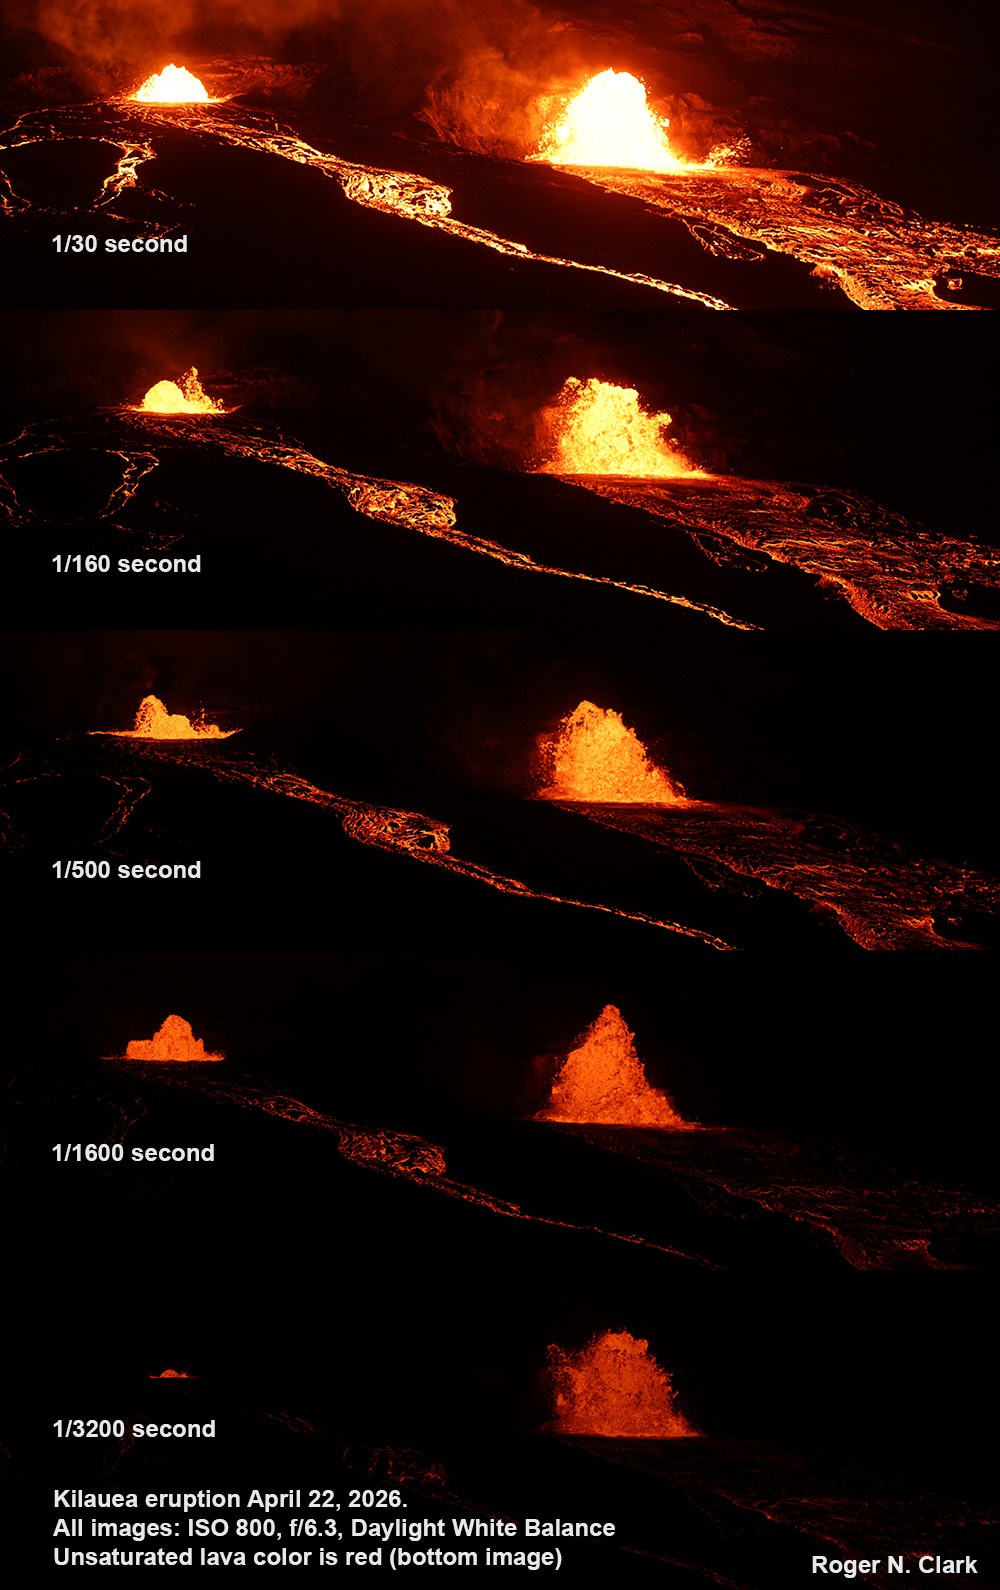
Kilauea lava temperatures as measured by the U.S. Geological Survey using various methods indicate that the temperatures are in the 1150 to 1200 Centigrade range, for example: Taking Kilauea's Temperature.. The above Table 1 indicates the lava temperature should be white at those temperatures. If so, the color should not depend on exposure time. Below I show the correct colors and the reasons for the color changes in photos.
Anyone with a physics background should be able to spot the flaw in Table 1. Lava is glowing due to the high temperature. That glow is called Black Body Thermal Emission, or Black Body radiation. The calculation of thermal emission is well understood. In my scientific background, I have to deal with thermal emission in infrared instruments and in measuring spectra of planetary surfaces. My first paper on this subject was Clark, 1979 (see References below), Planetary reflectance measurements in the region of planetary thermal emission. Other papers include measuring thermal emission through heavy smoke during the World Trade Center disaster to guide firefighting efforts (Clark et al., 2001a, 2001b), and in discovering water on the Moon where I needed to model and remove the lunar thermal emission (Clark, 2009, Clark et al., 2010).
The first clue to the Table 1 color error is the peak wavelength of thermal emission for a 1200C temperature is in the infrared, 2.415 microns (2415 nanometers, nm). That is about 4 times longer wavelength than red light. On the short wavelength side of the thermal emission Black Body peak, the intensity drops very rapidly, as seen in Figure 2. To the left of the peak in such a plot, is "Bluer" wavelength and it is called the blue side of the Black Body. Any emission in the visible on the "blue" side of the Black Body will appear red. This is seen in Figure 2 where the red, green and blue wavelengths are shown by the vertical colored lines. Where the green line intersects the black thermal emission curves is always lower then were the red line crosses the curves. Thus, green is always significantly lower then red, and similarly, blue is significantly lower than green. Those conditions make for red colors at all lava temperatures. Thus, the bottom panel in Figure 1 is showing the natural color.
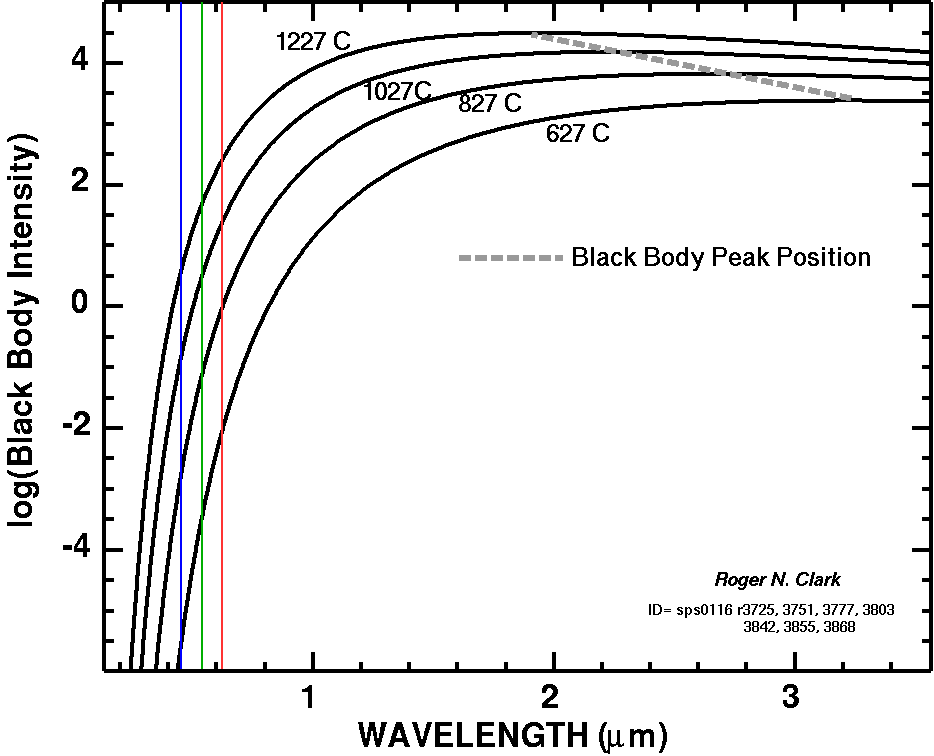
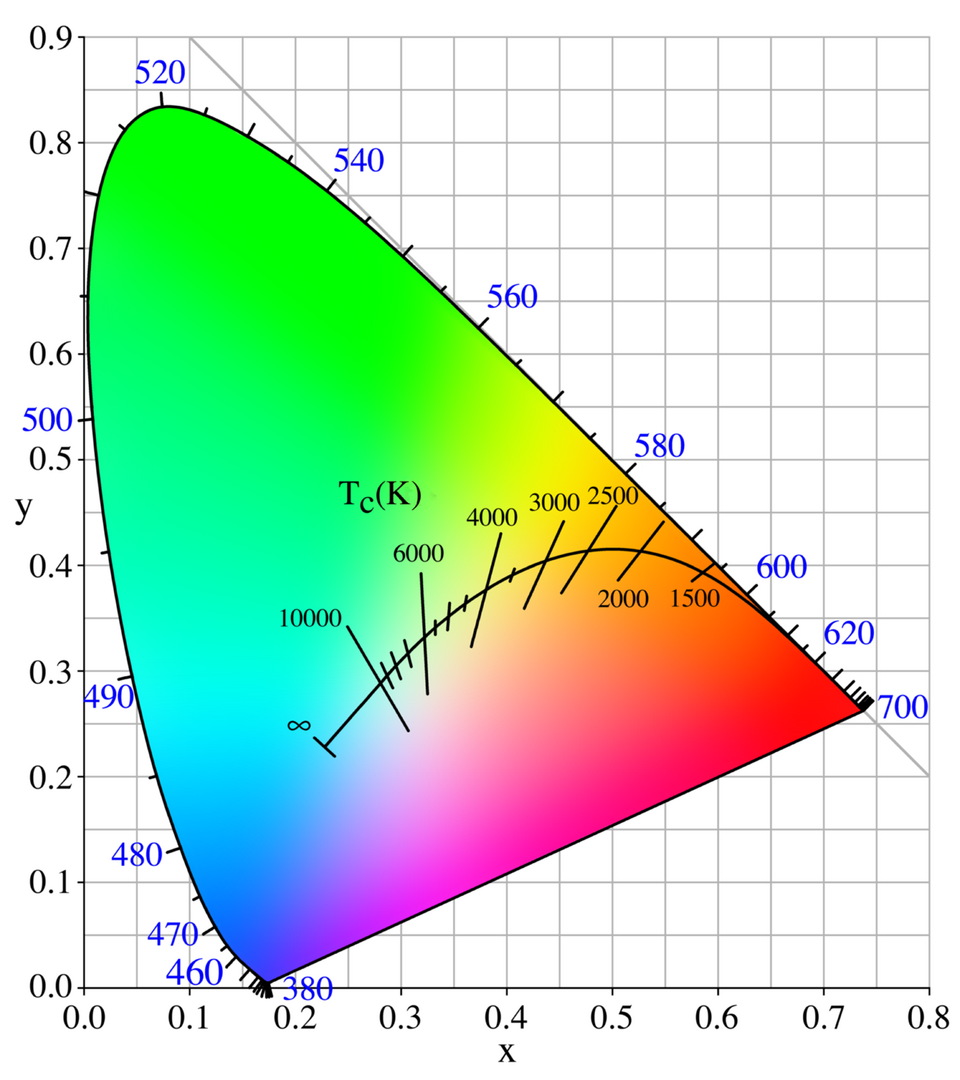
As illustrated in Figure 2, the emission as a function of wavelength is well understood and predictable. Therefore, the color can also be calculated, and that has been done. It is called the Planckian locus and is illustrated in Figure 3.
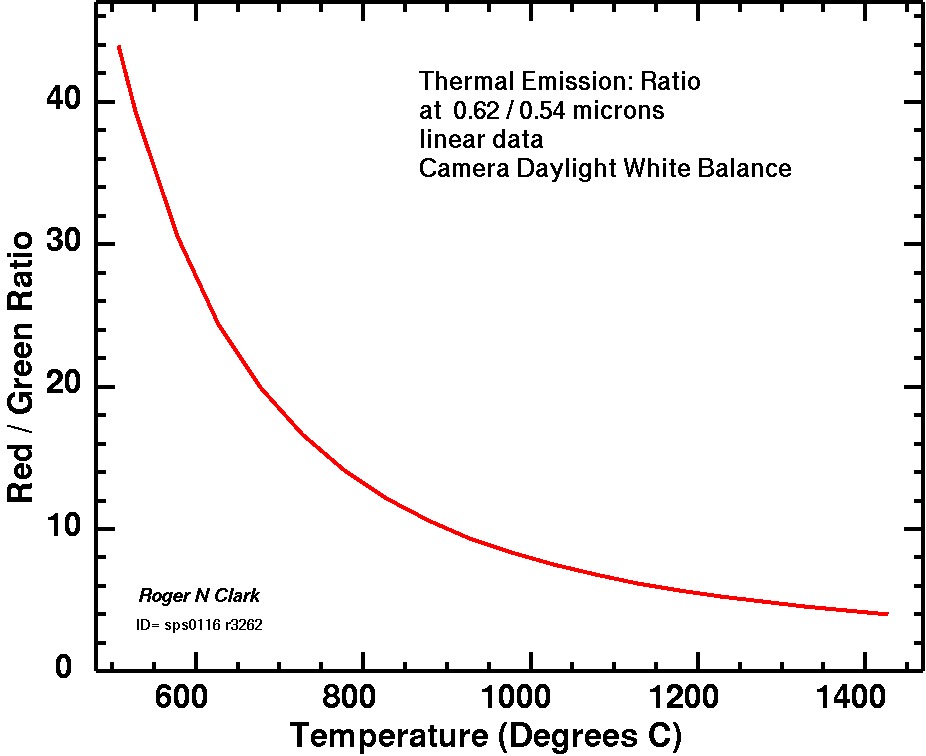
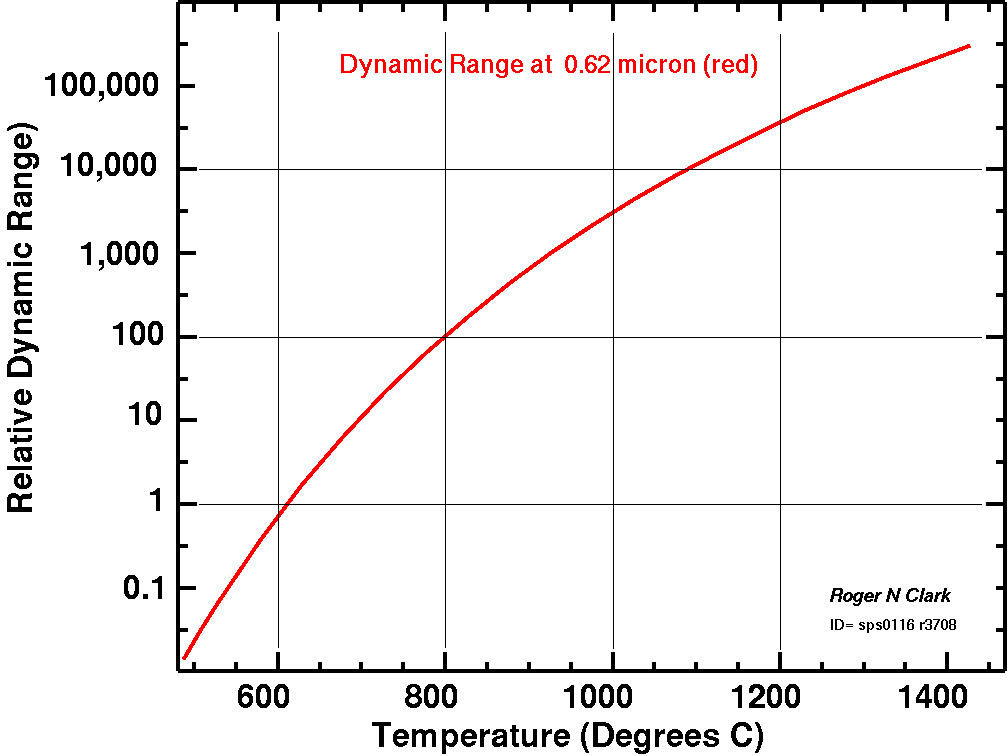
The ratio of red / green in a digital camera is shown in Figure 4 where we see the ration varies from about 5 at 1200 C to about 27 at 600 C, all indicating very red color.
White fine-grained snow, white paper, white ceramic, white paint: what makes white? White is an object the reflects all visible wavelengths equally, but only when illuminated by the Sun with the Sun reasonably high in the sky on a clear day. We evolved to see sunlight as white and those objects that reflect sunlight in all colors equally as white. Thus white means the spectrum of light that reaches our eyes is like that of the Sun as viewed through the Earth's atmosphere.
In other words, if the spectrum of visible light received by our eyes divided by the solar spectrum equals 1.0 at all wavelength, then that object would appear white.
Therefore for a Black Body thermal emission source were to appear white, it needs to have a temperature close to that of the Sun, or about 6000 Kelvin (5727 Centigrade). Thus, for lava to appear white, it would need to have a temperature like that of the Sun, about 5727 Centigrade! There are no measured lava temperatures this hot, so lava can not be white.
The problem is one of saturation of the red, or red and green, or red, green and blue channels. This is mainly due to the huge dynamic range of intensities on the "blue" side of the Black Body peak. The dynamic range in the red is shown in Figure 4 where we see that the dynamic range from lava at 600 C to lava at 1200 C is an intensity range of over 30,000 to 1!
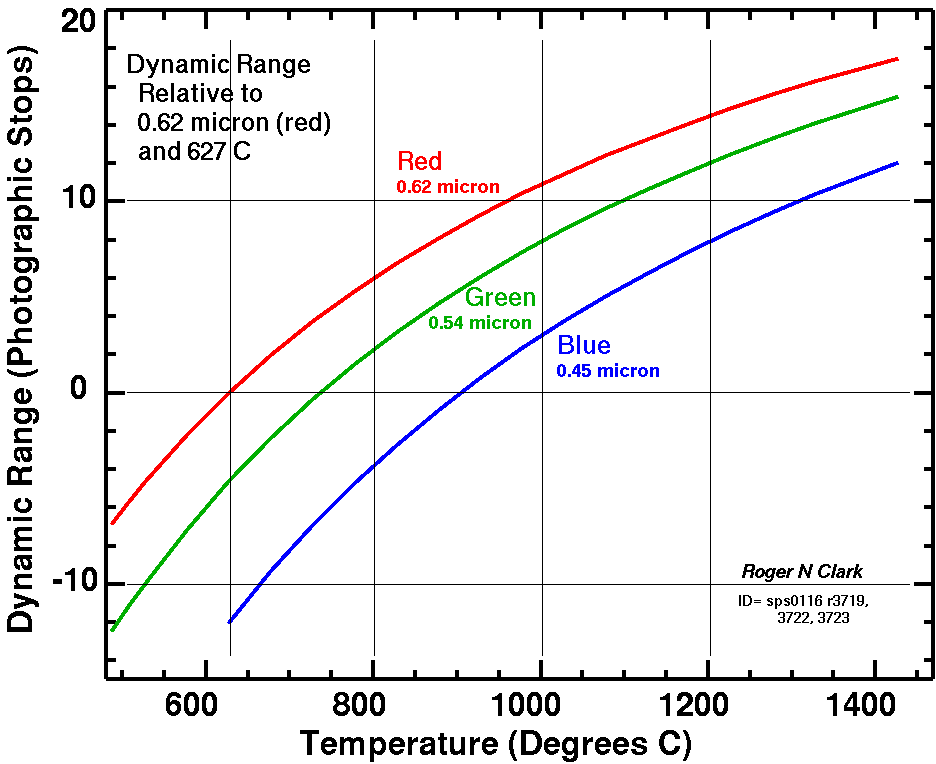
But to make a photo with all 3 colors within range, the situation is more difficult. The dynamic range for red, green and blue channels in photographic stops (factors of 2 or stop) is shown in Figure 6. There we see that considering only red and green channels, the dynamic range from 600 to 1200 C is -6 to 14 stops, for a total of 20 stops (over a million to 1 dynamic range)! If we include all three colors, would be about -11 to +15 stops, for a total of 26 stops, or about 60 million to one! Typical digital cameras have dynamic ranges of 10 to 14 stops. Thus, if one exposuses for lower temperature lava, the higher temperature lava will be saturated. This is exactly what we see in Figure 1.
I derived the colors as a function of exposure using a BT709 tone curve (that is the default tone curve for sRGB color out of a digital camera (e.g. the jpeg output). The results including exposing to drive the red channel into saturation are shown in Figure 7.
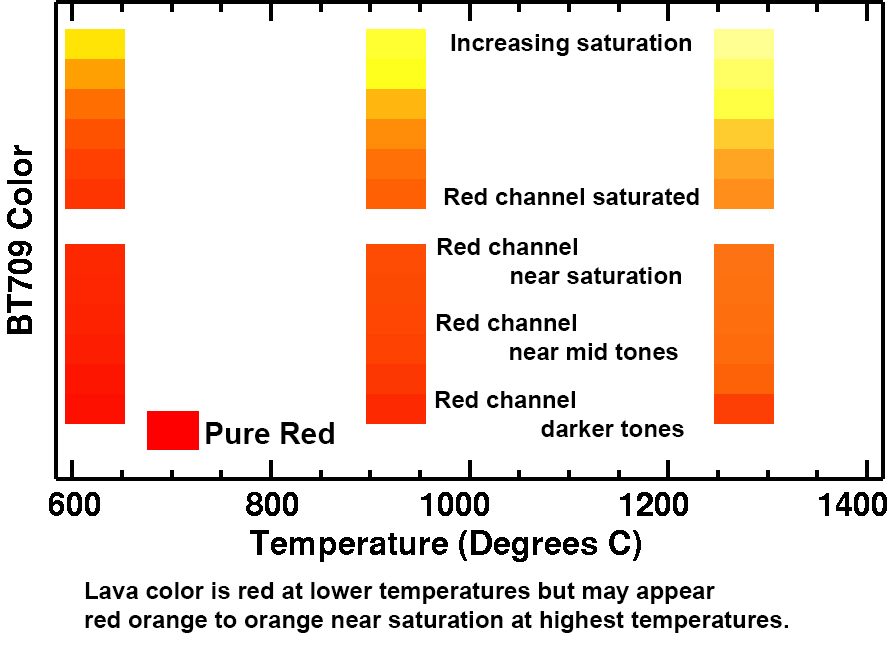
Another example of image saturation creating yellows and white colors is shown in Figure 8, along with some example RGB values. Again, exposure and saturation control lava color more than simply lava temperature. When the camera data are not sdaturated or near saturation, lava color is red, as seen in the bottom panel in Figure 8.
One method to keep from saturating bright lava while showing fainter lava is to exposure for the brightest lava so that it does not saturate, and then bring up fainter lava in brightness. This is shown in Figure 9.
Another method would be to do multiple exposures and then combine all the images in an HDR compression step.
A third method is to expose for the brightest lava and process for high dynamic range displays using HDR formats, including 4K UHD HDR.
The true color of lava is not white or yellow. It is red to red-orange. Beware of web sites that claim lava is white or yellow.
Set white balance to daylight for natural color.
Don't saturate the red channel, or the green channel if you want the natural color of lava.
To show lava at lower temperatures, longer exposures may be needed, and that will drive the hotter lava into saturation, creating artificial yellows and whites. Or better is to expose for the bright lava and bring up the brightness of fainter lava as illustrated in Figure 9.
If all lava were made to be natural color, red to red-orange, there would not be enough intensity range on a print or standard dynamic range display (SDR) for people to perceive much detail. Therefore, to give the impression of brightness, some red-channel saturation is needed, similar to that shown in Figure 9. Such saturation gives the impression of brightness because yellow appears brighter than deep red.
References and Further Reading
Ball, J. L., 2024, How Hot Hot when it comes Volcanoes, California Volcano Observatory.
Clark, R. N., 1979, Planetary reflectance measurements in the region of planetary thermal emission: Icarus, 40, p. 94-103. https://www.sciencedirect.com/science/article/abs/pii/0019103579900563
Clark, R. N., R. O. Green, G. A. Swayze, G. Meeker, S. Sutley, T. M. Hoefen, K. E. Livo, G. Plumlee, B. Pavri, C. Sarture, S. Wilson, P. Hageman, P. Lamothe, J. S. Vance, J. Boardman I. Brownfield, C. Gent, L. C. Morath, J. Taggart, P. M. Theodorakos, and M. Adams, 2001a, Environmental Studies of the World Trade Center area after the September 11, 2001 attack. U. S. Geological Survey, Open File Report OFR-01-0429, (approximately 260 pages printed), 2001. http://pubs.usgs.gov/of/2001/ofr-01-0429/
Clark, R.N., Green, R.O., Swayze, G.A., Hoefen, T.M., Livo, K.E., Pavri, B., Sarcher, C., Boardman, J., Vance, J.S., 2001b, Images of the World Trade Center site show thermal hot spots on September 16 and 23, 2001: U.S. Geological Survey, Open-File Report 01-0405, http://pubs.usgs.gov/of/2001/ofr-01-0405/
Clark, R. N., 2009, Detection of Adsorbed Water and Hydroxyl on the Moon, Science, 326, 562-564, DOI: 10.1126/science.1178105. https://www.science.org/doi/10.1126/science.1178105
Clark, Roger N., Carle M. Pieters, Robert O. Green, J.W. Boardman Noah E. Petro, and the M3 Science Team, 2010, Thermal Removal From Near-Infrared Imaging Spectroscopy Data of the Moon, J. of Geophysical Research 116, E00G16, doi:10.1029/2010JE003751. https://doi.org/10.1029/2010JE003751
Encyclopedia of Volcanoes, 2000, Academic Press, in the chapter by Kilburn, in a Table on page 294.
| Home | Galleries | Articles | Reviews | Best Gear | Science | New | About | Contact |
http://clarkvision.com/articles/volcanoes-and-the-color-of-lava/
First Published June 6, 2026
Last updated June 6, 2026