ClarkVision.com
| Home | Galleries | Articles | Reviews | Best Gear | Science | New | About | Contact |
Digital Camera Raw versus Jpeg Conversion Losses
by Roger N. Clark
| Home | Galleries | Articles | Reviews | Best Gear | Science | New | About | Contact |
by Roger N. Clark
Digital camera images can cake up a lot of space on the memory card in your camera. Many cameras have multiple formats, each with advantages and disadvantages. The data from a digital camera image sensor is the fundamental data with the only conversion due to the readout noise of the electronics and the limitations of the analog to digital converter. The image data at this stage is called the "raw" data. Many cameras have the ability to store this data. As the megapixel count of digital cameras increases, the file sizes of stored raw data becomes larger. Depending on the time of your imaging session, whether it be an afternoon, or many week vacation, storage can be a problem. The popular alternative is to record the image data as jpeg files. Jpeg is a "lossy" compression format, meaning in order to get a smaller file size, information is thrown out by the compression algorithm. The user has some control over the amount of loss, but even in its finest (highest quality) mode, jpeg still loses information. But how much information? On this web page I'll present some data so you might make your own decisions as to trading memory space for image quality loss.
I will only compare the highest quality jpeg compression available on each camera. In general, I record data in both raw and jpeg formats, but when I use jpeg, I only use the highest quality setting for the jpeg conversion. So the examples shows here are only for the highest quality jpeg modes on each camera.
I have analyzed data for 3 cameras: a top end professional DSLR: the Canon 1D
Mark II, a prosumer DSLR: the Canon 10D, and a Point and Shoot, "P&S" camera:
the Canon S60.
Each of these cameras is "Photon Noise Limited," meaning their performance
is essentially at the theoretical maximum possible for that size
and quantum efficiency of the sensor (ignoring read noise). Photon statistics,
read noise, and the raw to jpeg transfer function were all included in
the analyses. Data for these cameras, as well as other tests of
signal-to-noise, dynamic range, read noise, electron gain, and full well
capacity can be found at:
The Signal-to-Noise of Digital Camera
images and Comparison to Film,
Dynamic Range and Transfer Functions of Digital
Images and Comparison to Film, and
Dynamic Range of an Image.
For each test camera, I derived the image noise as a function of intensity and ISO speed, for 1) a linear raw output to a 16-bit tif file, 2) output to a 16-bit tif using the standard curve defined in Canon's conversion software, and 3) highest quality jpegs converted in camera and written as a jpeg file on the compact flash memory card. Note, other software that converts to 16-bit tif files from raw data might produce a slightly different result, and has not been tested in this study. But the differences with other converters to 16-bit tif will be quite similar as their curve shape appears very close to the canon converter, e.g. the Photoshop CS Converter, and Phase One.
For each output file format, noise was analyzed and ratioed to the noise from the sensor and all results were scaled to the 16-bit (0 to 65535 data number, DN) range for comparison. In the following figures, I plot the ratio: noise for the given file format divided by noise from the linear output. I call this ratio the loss factor. If the loss factor is 2, then the file format for that intensity has a signal-to-noise that is 2 times worse than the linear output from the detector.

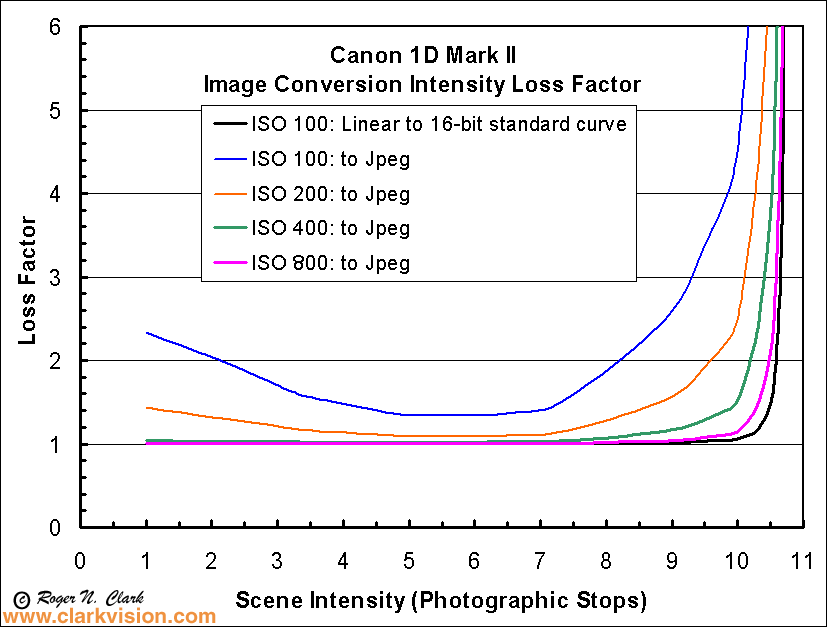
Figure 1. The Canon 1D Mark II loss factors.
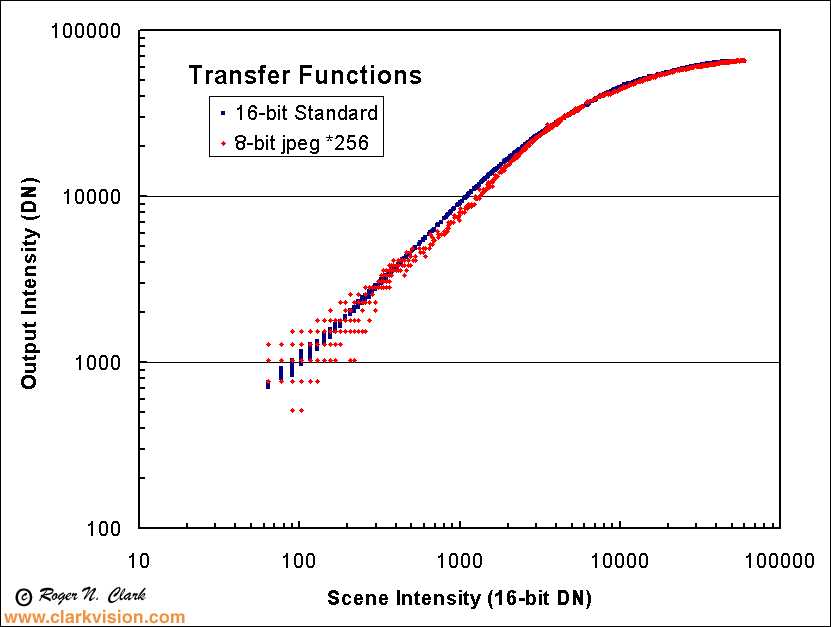
The Loss Factors for the Canon 1D Mark II digital camera are shown in Figure 1. What the plot shows is the increase in noise relative to the linear output from the camera. In the conversion to jpeg, an 8-bit/channel file format, from the 12-bit/channel raw data, the loss is not 4 bits (2*2*2*2 = 16). This is because other factors determine the true loss, the main one being noise. The full-well capacity of the Canon 1D Mark II digital camera is about 52,300 electrons. The noise due to photon counting statistics is then the square root of 52,300 or ~228.6. Thus the maximum signal-to-noise possible with this camera is only 52,300/228.6 ~ 229. That means that noise is masking at least some of the loss in precision when converting to 8-bit/channel data. At the low end (left on the plot), read noise dominates the statistics. At the upper end (right side of the plot) of the brightness range, the slope of the conversion curve limits conversion accuracy for both jpeg AND 16-bit standard curve conversions. This slope is shown in Figure 2 below, which is from Dynamic Range and Transfer Functions of Digital Images and Comparison to Film, where it is discussed in more detail.

Figure 2. Jpeg and raw Canon 1D Mark II digital camera transfer functions.
Note how the jpeg shows increased noise over the raw data.
Note how in Figure 1, as the ISO increases, the loss factor decreases. At ISO 800, there is little difference between 16-bit standard curve loss and the jpeg loss. Thus one can make a trade when trying to conserve digital image storage space in your camera. The loss from ISO 100 is large, and depending on what you want to do with the image, like make beautiful enlargements, you might consider the loss too great (I do). At ISO 200, the loss is less, but still significant, especially if you are concerned with loss of highlights. By ISO 400, the jpeg loss is becoming less, as long as you do not burn out the highlights. In ALL of these tests, the majority of image info is in the mid-range of the plot, so if you expose well, do not blow out the highlights, and have only 8 or so stops of dynamic range to deal with, the jpegs produces excellent images that are mostly indistinguishable from 16-bit tif images, and even the ISO 100 results would be great. Note that 8 stops of high signal-to-noise image data is more than even print film will deliver (see Dynamic Range and Transfer Functions of Digital Images and Comparison to Film), so unless you have a high dynamic range that you could not capture on film, the jpegs will be great. Note, 16-bit tiff still always delivers more information, so if you have doubts as to the dynamic range and have the space, record raw.
Note that if you clip the highlights in a digital image, and it appears clipped even in the raw file with standard conversion, try another conversion to linear output. You might gain a fraction of a stop more headroom, as well as higher signal-to-noise in the highlights.
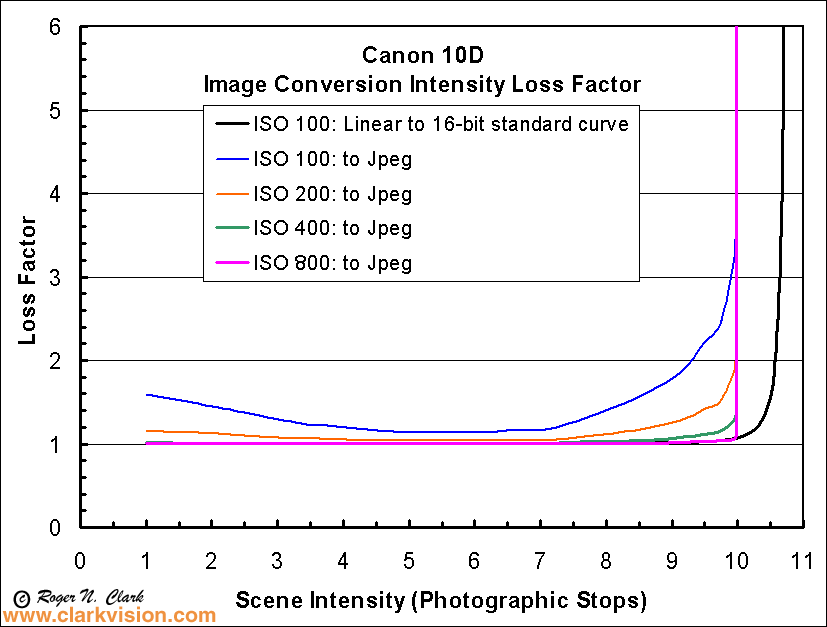
We have just looked at results for one of the top end digital cameras. Now let's compare a prosumer DSLR, the Canon 10D. Figure 3 shows the results. Two things jump out. 1) the jpeg loss factors are lower, and 2) the jpegs cut off the high end. The in-camera jpeg conversion in my Canon 10D has a stop less at the high end than the raw output. The lower signal-to-noise of the Canon 10D, compared to the 1D Mark II results in lower loss factors than seen on the 10D.

Figure 3. Comparison of the Canon 10D digital camera loss factors.
Now let's examine results for a consumer point and shoot digital camera, the Canon S60. The S60 has much smaller full well capacity, thus much lower signal-to-noise ratio, higher read noise, and therefore a much smaller difference in jpeg versus raw image quality.

Figure 4. Comparison of the Canon S60 digital camera loss factors.
Conclusions
Digital cameras, have different output formats and you can use those formats to save memory space in your camera, but that savings with jpeg compression comes at a price: image quality in the form of decreased signal-to-noise, and clipped highlights. But the loss becomes less with increasing ISO, and the loss is less on consumer cameras.
When deciding if jpeg losses are acceptable to you, consider examining the loss curves on this page, at the high end, a loss of 2 or more might be acceptable as that is the highest signal-to-noise region of the digital sensor's range. After all, if the signal-to-noise is over 200 at the high end, a factor of 2 loss brings that down such that the signal-to-noise is still higher than 100, which is still a high quality image. But at the low end, where the signal-to-noise is already low, a factor of 2 loss factor cam mean shadow detail and information in other dark parts of an image might be completely lost.
On my Canon 1D Mark II and 10D cameras, I record images in both raw and jpeg. I only use the finest, highest quality, jpeg compression. If I am imaging at ISO 100 of scenes I want to make big enlargements, I use raw format. If I need to conserve memory, and I am taking a lot of images at higher ISO, especially 400 and higher, I tend to shoot more jpegs. With the knowledge of the results here, I can use the information to better make the decision of when I might trade raw versus jpeg to conserve storage.
See also:
Film Versus Digital Executive
Summary.
Also, see the article Dynamic Range of an Image
which shows that real scenes can have over 10 photographic stops of
dynamic range (a factor of over 1000).
Then explore the article on
The Signal-to-Noise of Digital Camera
images and Comparison to Film.
Equations Used
The noise from the sensors is: N = sqrt(e2 + r2), where e = the number of electrons and r = the read noise at each ISO.
The effective noise, EN = sqrt(N2 + Q2), where N is defined above, and Q is the noise due to quantization in the conversion from the linear output to the integer output file format using the standard curves, like that shown in Figure 2. As the slope becomes more horizontal in Figure 2, quantization noise becomes dominant, and in fact in some cameras, the noise effectively becomes infinite because there is no signal variation recorded. The slope in Figure 2 for the Canon 1D Mark II for low intensities is around 9, the slope is 1 at about Scene Intensity DN 12,500 (8.5 on the Scene Intensity Photographic Stop scale), dropping to about 0.02 around DN 50,000, (photo stop 10.6). This low slope and the resulting quantization of the signal is the reason for the loss at high intensities on the plots on this page, and that loss is greater for 8-bit jpeg quantization versus 16-bit tif quantization (irregardless of compression errors).
The slope of the transfer curve and the quantization of the output file format
results in a loss from the original signal according to the equation:
Q = nb*(fw/65535)/(S*(DN+1) - S*DN),
where Q = quantization loss, nb = number of bits (e.g. 8 for jpeg, 12 for raw),
fw = the full well capacity of a pixel in electrons, DN is the linear
output 16-bit data number (see notes below; note 16-bit is scaled from
12-bit numbers, as that is what we measure in the 16-bit tiff converted
images), which is the Scene Intensity horizontal axis in Figure 2,
and S is the slope of the transfer curve, e.g. the slope of the curve
in Figure 2.
The Loss Factor, LF = sqrt((N2 + Q22)/(N2+Q2)) where Q2 is the noise quantized by the A to D converter (12-bits on the systems tested here).
Notes and References
Raw vs JPEG experiment: http://www.ics.uci.edu/~eppstein/pix/rawvsjpg This page examines real images raw and jpeg from a Canon D60 camera.
DN is "Data Number." That is the number in the file for each pixel. I'm quoting the luminance level (although red, green and blue are almost the same in the cases I cited).
16-bit signed integer: -32768 to +32767
16-bit unsigned integer: 0 to 65535
Photoshop uses signed integers, but the 16-bit tiff is unsigned integer (correctly read by ImagesPlus).
The fundamental error in measuring a photon signal is the square root of the number of photons counted, Poisson Statistics. The maximum number of photons one can count with a sensor is the max number of electrons in that can be held in the well. There is one electron per photon. If one fills the pixel well with 40,000 electrons, then the noise in the signal is square root 40,000. So whatever the signal is, the error (noise) is square root of the number of electrons (photons). The more photons counted, the higher the signal-to-noise. The signal-to-noise = # photons/square root(# photons) = square root(# photons) In the shadows in an image, one may get only a few hundred photons, so the noise is square root of those few hundred.
Photons  Noise   signal-to-noise
    9      3           3
  100     10          10
  900     30          30
10000    100         100
40000    200         200
The Poisson Distribution http://mathworld.wolfram.com/PoissonDistribution.html
Signal-to-Noise Ratio in digital imaging: http://www.photomet.com/library_enc_signal.shtml
Photon noise: http://www.roperscientific.de/tnoisesrc.html
Dynamic range is defined as maximum intensity / minimum intensity, where intensity is scene radiance. For a sensor, like in a digital camera, the minimum is usually limited by noise. Thus the dynamic range that can be recorded by a sensor can be smaller than actual scene dynamic range.
Posterization is the integer quantization of digital data. For example, 16-bit data has 65535 levels while 8-bit data has only 256 levels. In the conversion from 16-bit (or 12-bit camera) data to 8-bit, some information is lost.
| Home | Galleries | Articles | Reviews | Best Gear | Science | New | About | Contact |
http://clarkvision.com/articles/raw.versus.jpeg1
First published May, 2004.
Last updated February 3, 2005