ClarkVision.com

| Home | Galleries | Articles | Reviews | Best Gear | Science | New | About | Contact |
by Roger N. Clark
| Home | Galleries | Articles | Reviews | Best Gear | Science | New | About | Contact |
by Roger N. Clark
How fine should sampling be to record all the detail in images? There is the well known Nyquist theorem that says if you sample an infinite sequence at least 2 samples per cycle you can retrieve all the information possible. The most important condition is the signal must be bandwidth limited. But the real world of imaging does not have infinite sampling, nor are images perfectly band-width limited. In real-world imaging, whether scanned film, or images from a digital camera, the sampling is finite and sampling might result in unusual side effects.
To illustrate the effect and to show how much sampling is needed to capture all image detail correctly, a 100 lines/inch (3.94 lines/mm) Ronchi ruling was scanned in transmittance on a scanner that had 2400 pixels-per-inch optical resolution.
The Nyquist theorem refers to cycles. Consider a sine wave. the cycle of a sine wave goes from 0 to 1, back to 0, then to -1 and back to 0 for one full cycle, The +1 and -1 are like the bright and dark lines in images. Cycle refers to a bright line plus dark line pair. So the Ronchi ruling which refers to 100 lines/inch means there are 100 cycles per inch or 100 line pairs per inch. Thus, the Nyquist sampling for this test would occur at least 200 pixels per inch and sample the ruling to infinity.
For this test the ruling was tilted slightly so that the phase between scanner pixels and lines on the ruling varied in position along the scan. Scans were done at different pixels per inch to illustrate sampling effects. Results are below.
The results illustrate sampling errors occur at sampling less than 6x the lines/length (3x Nyquist). Note the black/white phase inversion in some of the samples, like 100 dpi (0.5x Nyquist) and Nyquist sampling (200 dpi). Only the 3x Nyquist shows a clean pattern free of artifacts. (Not shown: the 2x Nyquist shows patterns similar to 1.5x sampling, just with horizontal banding closer together).
Why does the sampling near Nyquist give unusual results in this case? The lines in the image are not in phase with the sampling. To be "in phase," it means that sampling occurs only at the peaks and valleys of the image data, and a pixel would not fall on a boundary. Clearly this condition is not met in image data of real scenes in general.
The illustrations here apply to sampling image detail as out of phase signals in general, whether it is a scanner scanning film detail, or a digital camera recording image detail.
Now let's look at a real example. This is the same
image used in the
scan and
image detail web page.
In real images, image detail is often limited
by diffraction, lens aberrations, the detector, or
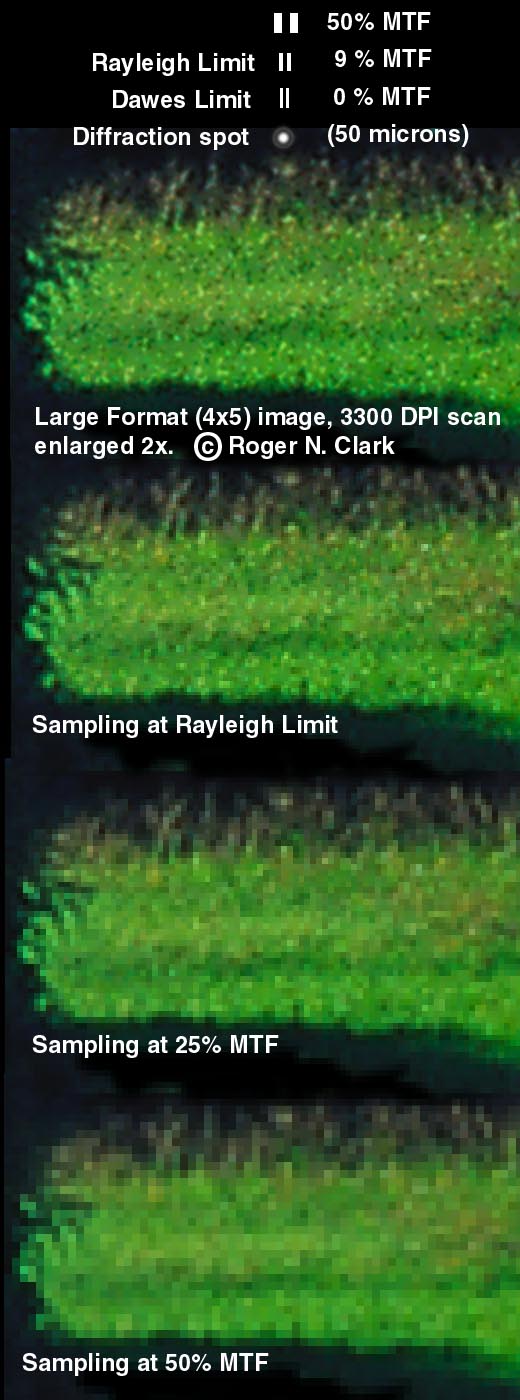
other things, like blur or motion. The image below is limited
mainly by diffraction and some by film grain.
How much sampling does one need in a near diffraction-limited
image?
The 3300 dpi scan (top image) is 7.7-micron pixels, or about 3 pixels per cycle at the Dawes limit. The next image is 2 pixels per cycle at the at the Rayleigh limit. There is slight degradation of the image. Sampling less than this rapidly lowers image detail as seen in the bottom two images. The conclusion is 2 to 3 pixels per cycle at the Dawes limit records close to all the detail in the image, but 2 pixels per cycle at the Rayleigh limit is pretty close.
The above test using film may be confusing because the grass blades are incompletely resolved for two reasons: diffraction, and film grain. So a more rigorous test was devised using the test chart in Figure 3. The chart was printed at 300 ppi and placed 20,700 mm away from a camera with a 180 mm lens and the chart was imaged. The distance was such that some of the lines are well below the diffraction spot diameter, and if there were alternating lines with separations the thickness of the lines, no lines could be resolved (0% MTF; that is illustrated by the numbers by each line and spot: they appear as blobs in Figure 4 because the lines making up the numbers are too close together to be resolved). But the test results (Figure 4) clearly show that small lines and spots, smaller than the diffraction limit, can be detected if they are isolated (not near other spots or lines). Also note that the smaller lines and spots appear smaller than the diffraction spot diameter. This is due to a contrast effect: only the brightest central portion of the diffraction disk is obvious. Such small detail needs to be adequately sampled, for example, when scanning film. This test is of a relatively low contrast subject. real images can include higher contrast sub-diffraction subjects, including stars, backlit hair, twigs, branches, grass blades, and many other subjects. Scanning such detail can be important in recording and printing fine detail that makes prints have that "wow" factor.


| Home | Galleries | Articles | Reviews | Best Gear | Science | New | About | Contact |
http://clarkvision.com/articles/sampling1
First published October, 2001.
Last updated October 07, 2010.