The Canon 6D Digital Camera Review:
Sensor Noise, Thermal Noise, Dynamic Range, and Full Well Analysis
by Roger N. Clark
All images, text and data on this site are
copyrighted.
They may not be used except by written permission from Roger N. Clark.
All rights reserved.
If you find the information on this site useful,
please support Clarkvision and make a donation (link below).
This page shows an analysis of noise, dynamic range, and full well
capacity of a Canon 6D camera. It also shows the dark current and
noise from thermal dark current as a function of temperature. The Canon
6D is the latest in the Canon full-frame lineup, and with this review
(January 2014) I find the sensor performance so good that this camera
is my choice in the Canon line for full frame low light photography.
The pattern (banding) noise sets new lows for Canon (that is good),
with low read noise, low thermal dark current noise making the camera
superb for low light work. You'll find many images in my nightscapes
gallery made with this camera. The new 7D Mark II, November 2014,
is the only camera in the Canon line with better (low) banding noise.
If you find the information on this site useful and wish to purchase the equipment
that I use to make images like this one, please use
the links to B&H Photo to make the purchases. By using the link, you will help support
clarkvision.com at no additional cost to you. I have used B&H Photo for decades and
have always had a great experience and their prices are very good. Please support Clarkvision.
 Click here to go to B&H Photo and Purchase the Canon EOS 6D DSLR Camera
The lowest possible noise from a system detecting light is the noise
due to Poisson statistics from the random rate of the arrival of
photons. This is called photon statistics, or photon noise. Noise from
the electronics will add to the photon noise. Noise in Canon 6D images
is limited by photon statistics at high signal levels and by electronic
noise from reading the sensor (called readout noise) and noise from the
downstream electronics at very low signal levels. In the case of high
signal levels, a system that is photon statistics limited enables us to
directly measure how many photons the sensor captures, and by increasing
the exposure, we can determine how many photons are required to saturate
the sensor. That is called the full well capacity, or simply, maximum
signal capacity. With data on the lowest noise to the highest signal,
we can then determine the dynamic range of the sensor.
The data and analysis results below show how the canon 6D sensor performs.
Table 1 shows the results and these results will be added to the graphs at
Digital Sensor Performance summary
for comparison with other cameras (for now you can plot the values yourself
from the data below).
The read noise, reaching low values of only 1.7 electrons at ISO 6,400
is among the lowest I have measured. This is similar to the 1D
Mark IV and 1DX cameras. Older Canon cameras tested above 2 electrons
read noise. The data that were measured for this evaluation are presented
in Appendix 1.
But even more impressive than the high signal and low read noise, is the
far better control of pattern noise. The 6D sensor performs well ahead
of the 1DX at low ISO, similar to that for the 1DX at moderate to high ISOs,
but the 1DX pulls slightly ahead at very high ISOs.
The pattern noise of the 6D is overall the 2nd lowest I have measured
for any Canon camera (The Canon 7D Mark II is the lowest as of November,
2014). pattern noise limits the detail visible in shadows, and the
ability to pull out low level detail or faint signal. Pattern noise is
particularly visible to the human eye+brain system. It is very important
to be as low as possible in low light photography as in night and astro
photography.
              Table 1
-------------------------------------------------
               Apparent  Maximum     Measured
  ISO  Gain   Read Noise  signal    Dynamic range
       e/DN  (electrons) (electrons)   stops

    50  5.95     29.      79600        11.4
   100  5.95     29.      79800        11.4
   160           14.5
   200  2.97     14.      39800        11.5
   400  1.49      8.0     20000        11.3
   800  0.74      4.6      9900        11.1
  1600  0.37      2.9      4900        10.7
  3200  0.186     2.2      2500        10.2
  4000            2.2
  6400  0.093     1.7      1250         9.5
 12800  0.046     1.7       620         8.5
 25600  0.023     1.7       310         7.5
 51200  0.012     1.7       160         6.6
102400  0.0058    1.6        79         5.6

maximum DN: ISO  50 = 13387
            ISO 100 = 13415
offset DN: 2048

Pixel pitch= 6.58 microns.
20.0 megapixels.
-------------------------------------------------
Derived Parameters:
S/N on 18% gray card per pixel, ISO 100 = 120
S/N on 18% gray card per pixel, ISO 1600 = 29.7
Sensor Full Well Capacity per pixel at lowest ISO: 79,800 electrons.
Sensor dynamic range per pixel = 79800/1.7 = 73,800 = 15.5 stops.
(note: limit read noise to ISO that give at least 8 stops dynamic range)
ISO at unity gain (scaled to 12 bit) = 2400 (14-bit unity gain = ISO 600).
Pixel linear density = 152 pixels / mm
Pixel density = 23097 pixels / square mm
Sensor maximum signal density at ISO 200 = 919 electrons / square micron
Sensor maximum signal density at ISO 1600 = 113 electrons / square micron
Sensor read noise density (best read noise) = 243 electrons / square mm
Sensor dynamic range density at ISO 1600 = 18.0 stops dynamic range / square mm
Low Signal Pattern noise: virtually non-existent.
New Low Light sensitivity Factor: 39.0 (= sensor max signal density at ISO 1600 / read noise at ISO 1600)
Full Sensor Apparent Image Quality, FS-AIQ = 120
Focal Length Limited Apparent Image Quality, ISO 1600, Constant output Size, FLL-AIQ1600 = 118
Values in the above table are described at
Digital Sensor Performance summary.
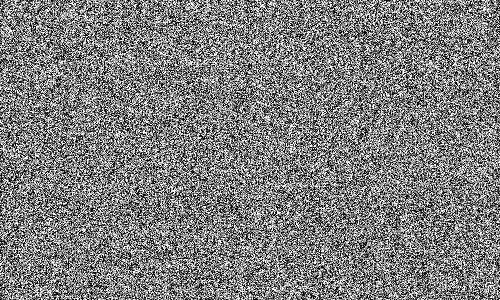
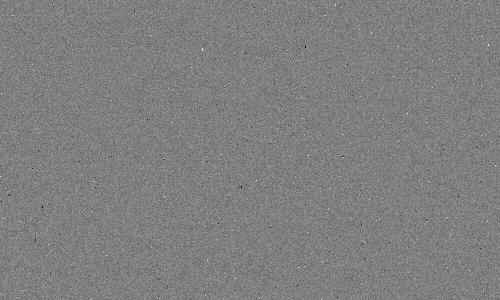
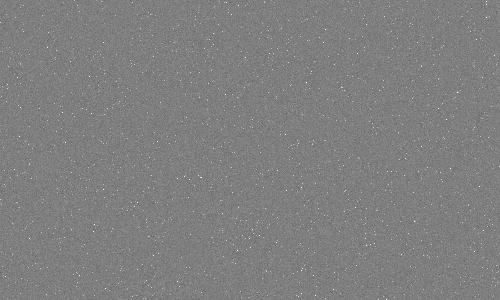
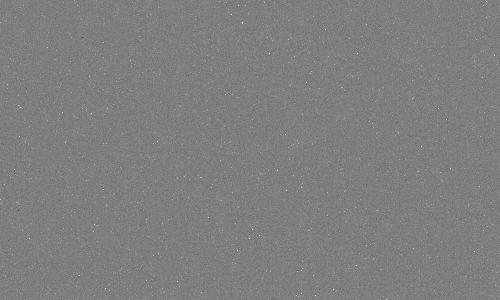
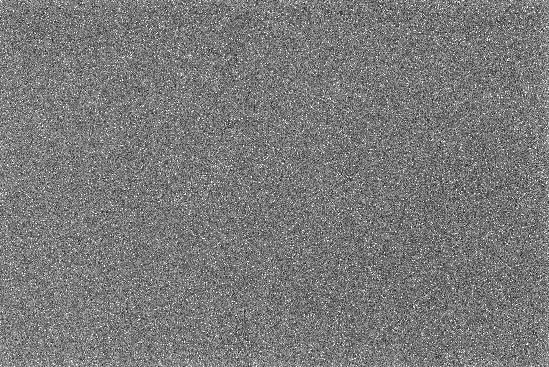
Pattern (Banding) Noise
Tables 2a, 2b show the noise as a function of ISO in image form. The images
illustrate several things: 1) lower banding noise at higher ISOs. 2)
Better detection of smaller signals at higher ISOs (the random noise
decreases). 3) At a certain high ISO, improvements decrease, meaning
there is no benefit to higher ISO. Note, ISO is a post sensor gain and
does not increase sensitivity. Increasing ISO digitizes a smaller range
(see Table 1) but does improve the noise floor up to a point. These images are
significantly better at lower ISO than older cameras, like the Canon
1D Mark IV and 1DX, and significantly better at all ISO for cameras
like the Canon 5D Mark II and 5D Mark III.
| Table 2a. Apparent Read Noise, Central Image |
 | ISO 50
Image Range:
-20.00 to 20.00 electrons about the mean
Central 500 x 300 pixel statistics:
min=22466.40 electrons
max=23010.30 electrons
mean=22724.48 electrons
standard deviation= 53.72 electrons |
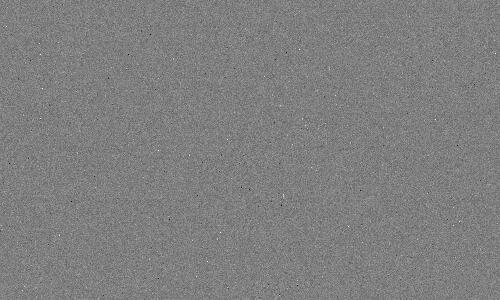
 | ISO 100
Image Range:
-20.00 to 20.00 electrons about the mean
Central 500 x 300 pixel statistics:
min=11229.58 electrons
max=11462.26 electrons
mean=11341.60 electrons
standard deviation= 26.87 electrons |
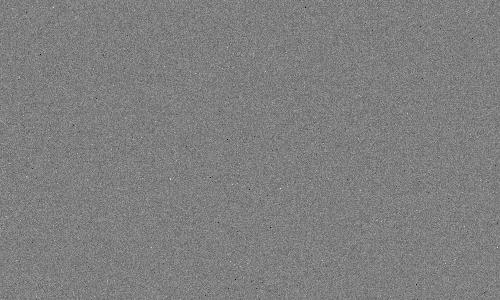
 | ISO 200
Image Range:
-20.00 to 20.00 electrons about the mean
Central 500 x 300 pixel statistics:
min=5603.71 electrons
max=5767.14 electrons
mean=5671.24 electrons
standard deviation= 13.37 electrons |
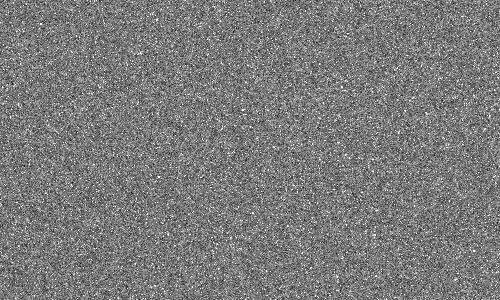
 | ISO 400
Image Range:
-20.00 to 20.00 electrons about the mean
Central 500 x 300 pixel statistics:
min=2790.36 electrons
max=2924.22 electrons
mean=2826.00 electrons
standard deviation= 7.49 electrons |
 | ISO 800
Image Range:
-20.00 to 20.00 electrons about the mean
Central 500 x 300 pixel statistics:
min=1380.69 electrons
max=1503.51 electrons
mean=1412.70 electrons
standard deviation= 4.34 electrons |
 | ISO 1600
Image Range:
-20.00 to 20.00 electrons about the mean
Central 500 x 300 pixel statistics:
min=687.05 electrons
max=802.20 electrons
mean=716.82 electrons
standard deviation= 2.90 electrons |
 | ISO 3200
Image Range:
-20.00 to 20.00 electrons about the mean
Central 500 x 300 pixel statistics:
min=324.19 electrons
max=439.62 electrons
mean=348.17 electrons
standard deviation= 2.12 electrons |
 | ISO 6400
Image Range:
-20.00 to 20.00 electrons about the mean
Central 500 x 300 pixel statistics:
min=153.38 electrons
max=208.28 electrons
mean=178.23 electrons
standard deviation= 1.75 electrons |
 | ISO 12800
Image Range:
-20.00 to 20.00 electrons about the mean
Central 500 x 300 pixel statistics:
min= 61.53 electrons
max=111.84 electrons
mean= 88.04 electrons
standard deviation= 1.75 electrons |
 | ISO 25600
Image Range:
-20.00 to 20.00 electrons about the mean
Central 500 x 300 pixel statistics:
min= 17.89 electrons
max= 66.31 electrons
mean= 45.06 electrons
standard deviation= 1.75 electrons |
 | ISO 51200
Image Range:
-20.00 to 20.00 electrons about the mean
Central 500 x 300 pixel statistics:
min= 2.00 electrons
max= 38.32 electrons
mean= 22.56 electrons
standard deviation= 1.70 electrons |
| Table 2b. Apparent Read Noise, Full Image, sub-sampled |
 | ISO 50
Image Range:
-20.00 to 20.00 electrons about the mean
Full image statistics:
min=22444.20 electrons
max=28227.30 electrons
mean=22724.28 electrons
standard deviation= 53.20 electrons |
 | ISO 100
Image Range:
-20.00 to 20.00 electrons about the mean
Full image statistics:
min=11201.88 electrons
max=14088.22 electrons
mean=11341.76 electrons
standard deviation= 26.53 electrons |
 | ISO 200
Image Range:
-20.00 to 20.00 electrons about the mean
Full image statistics:
min=5598.17 electrons
max=8492.82 electrons
mean=5671.44 electrons
standard deviation= 13.29 electrons |
 | ISO 400
Image Range:
-20.00 to 20.00 electrons about the mean
Full image statistics:
min=2772.42 electrons
max=5859.48 electrons
mean=2825.99 electrons
standard deviation= 7.44 electrons |
 | ISO 800
Image Range:
-20.00 to 20.00 electrons about the mean
Full image statistics:
min=1361.37 electrons
max=4443.60 electrons
mean=1412.61 electrons
standard deviation= 4.36 electrons |
 | ISO 1600
Image Range:
-20.00 to 20.00 electrons about the mean
Full image statistics:
min=669.20 electrons
max=4003.30 electrons
mean=716.77 electrons
standard deviation= 2.98 electrons |
 | ISO 3200
Image Range:
-20.00 to 20.00 electrons about the mean
Full image statistics:
min=306.00 electrons
max=2624.46 electrons
mean=348.16 electrons
standard deviation= 2.19 electrons |
 | ISO 6400
Image Range:
-20.00 to 20.00 electrons about the mean
Full image statistics:
min=128.85 electrons
max=265.00 electrons
mean=178.25 electrons
standard deviation= 1.78 electrons |
 | ISO 12800
Image Range:
-20.00 to 20.00 electrons about the mean
Full image statistics:
min= 45.19 electrons
max=129.52 electrons
mean= 88.08 electrons
standard deviation= 1.77 electrons |
 | ISO 25600
Image Range:
-20.00 to 20.00 electrons about the mean
Full image statistics:
min= 3.12 electrons
max= 76.69 electrons
mean= 45.10 electrons
standard deviation= 1.78 electrons |
 | ISO 51200
Image Range:
-20.00 to 20.00 electrons about the mean
Full image statistics:
min= 0.13 electrons
max=125.74 electrons
mean= 22.57 electrons
standard deviation= 1.73 electrons |
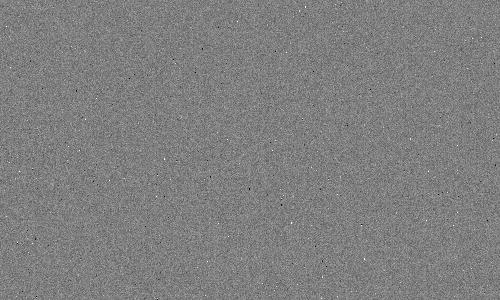
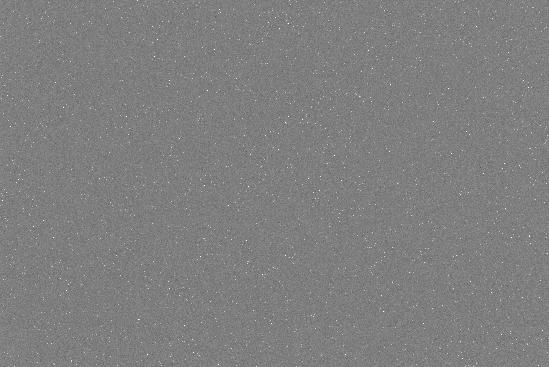
Dark Current and Thermal Noise
On long exposures, electrons collect in the sensor due to thermal
processes. This is called the thermal dark current. As with photon noise,
the noise from thermal dark current is the square root of the
signal. One can subtract the dark current level, but not the noise
from the dark current. Many modern digital cameras have on sensor
dark current suppression, but this does not suppress the noise
from the dark current. It does, however, prevent uneven
zero levels that plagues cameras before the innovation (Canon
cameras before circa 2008). Examples of this problem are seen
at:
Long-Exposure Comparisons.
The dark versus temperature for the Canon 6D is shown in Table 3.
The uniformity of the 6D long exposure dark frames, Tables 4a, 4b, and 4c,
is outstanding. There is no noticeable banding except a trace amount shown in
Table 4c, enabling multiple
frames to be averaged, or very long exposures to be made without
annoying pattern noise.
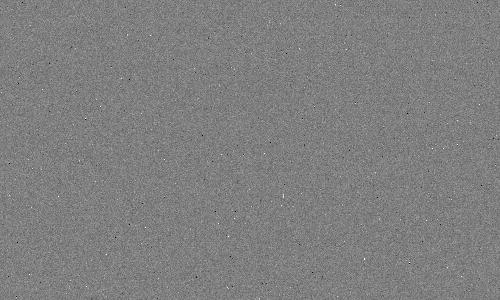
The small amount of pattern noise shown in the strong stretch in Table 4c
is the smallest I have observed in any Canon Camera.
Thermal noise ultimately limits the weakest
signals that can be detected. Thermal dark current is very
temperature dependent, so only compare these values to other sensors made
at the same temperature.
The dark current increased 12.4 times in the 6D
from 6 to 26 degrees C or doubling about every 5.5 degrees C. Note too
that the lower the temperature, the fewer hot pixels show in the image.
At temperatures lower than about 10 degrees C, the the rate is less.
                             Table 3
             Canon 6D Dark Current and Noise vs Temperature

                                     Noise from Dark Current in Electrons
 Temperature   Dark current            versus  Exposure Time (seconds)
  (C)   (F)   electrons/sec.    10 sec    30 sec    60 sec    120 sec    300 sec

   26    79     3.023             5.5       9.5      13.5      19.0       30.1
   11    52     0.303             1.7       3.0       4.3       6.0        9.5
    6    43     0.244             1.6       2.7       3.8       5.4        8.6
    5    41     0.230             1.5       2.6       3.7       5.2        8.3
    1    34     0.217             1.5       2.5       3.6       5.1        8.1
| Table 4a. Thermal Noise, Central Image |
 |
ISO 1600
Exposure= 713 seconds
T= 26 C
Image Range:
-100.00 to 100.00 electrons about the mean
Central 500 x 300 pixel statistics:
min= 672 electrons
max= 5214 electrons
mean= 761 electrons
standard deviation= 46.52 electrons |
 |
ISO 1600
Exposure= 692 seconds
T= 6 C
Image Range:
-100.00 to 100.00 electrons about the mean
Central 500 x 300 pixel statistics:
min= 714 electrons
max= 5213 electrons
mean= 758 electrons
standard deviation= 13.32 electrons |
 |
ISO 1600
Exposure= 675 seconds
T= 1 C
Image Range:
-100.00 to 100.00 electrons about the mean
Central 500 x 300 pixel statistics:
min= 716 electrons
max= 5213 electrons
mean= 758 electrons
standard deviation= 12.44 electrons |
| Table 4b. Thermal Noise, Full Image, sub-sampled |
 |
ISO 1600
Exposure= 713 seconds
T= 26 C
Image Range:
-100.00 to 100.00 electrons about the mean
Full image statistics:
min= 0 electrons
max= 5222 electrons
mean= 760 electrons
standard deviation= 49.10 electrons |
 |
ISO 1600
Exposure= 692 seconds
T= 6 C
Image Range:
-100.00 to 100.00 electrons about the mean
Full image statistics:
min= 698 electrons
max= 5213 electrons
mean= 758 electrons
standard deviation= 12.68 electrons |
 |
ISO 1600
Exposure= 675 seconds
T= 1 C
Image Range:
-100.00 to 100.00 electrons about the mean
Full image statistics:
min= 703 electrons
max= 5213 electrons
mean= 759 electrons
standard deviation= 11.63 electrons |
| Table 4c. Thermal Noise, Full Image, sub-sampled |
 |
ISO 1600
Exposure= 675 seconds
T= 1 C
Image Range:
-20.00 to 20.00 electrons about the mean
Full image statistics:
min= 703 electrons
max= 5213 electrons
mean= 759 electrons
standard deviation= 11.63 electrons |
Figure 1. Dark current as a function of temperature for 5 cameras
are compared. The temperatures are the camera temperature reported in
the camera's EXIF data and was 2 to 10 degrees higher than measured
ambient temperature. The more massive 1D cameras tended to have a
larger difference between internal camera and ambient temperature.
For example, the 7D points at -10 and -11 C where made side-by-side
with the 1DIV in a freezer and the 1D reported -3 and -5 C.
The freezer temperature was -13 C and the cameras cooled for 2 hours.
The upturn in the trend for the 6D and 1DX may be due to internal
heating and the sensor was actually warmer than the reported
temperature. Even so, we see a clear trend of increasing dark current
with increasing temperature. Dark current tends to double for about
every 5 to 6 degrees C.
The 6D dark current as a function of temperature is shown in Figure 1.
In general the trend for all canon cameras is similar, but cameras
with larger pixels tend to have higher dark currents at the same
temperature. All cameras seem to show a relative dip in the
log-linear trend with relatively lower dark current between
freezing and room temperature (~0 to 20 C).
See comparisons of dark frames from many cameras at:
Digital Cameras and Long Exposure Times:
Noise and Dark Current Comparisons ../long-exposure-comparisons/
Procedures for performing this analysis are described in:
Procedures for Evaluating Digital Camera Noise, Dynamic Range, and Full
Well Capacities; Canon 1D Mark II Analysis
Conclusions
The Canon 6D sensor has very impressive performance, from very low
measured read noise to the lowest pattern noise at low ISO that I have seen to date on
a Canon sensor. It also has the highest dynamic range I have measured
for a Canon sensor. The 6D has excellent high signal response, making
this camera a top performer. In long exposures, there is no visible
banding of any significance (a trace amount of banding can be seen in
10-minute exposures but not enough to be objectionable in real images),
and no visible hot spots from electronics heating the sensor on one side.
Dark current is similar to that from the 1D Mark IV, and similar to the
7D above about 10 C.
The constant dark level with long exposure time indicates the
camera has on-sensor dark current suppression. This, however, does
not suppress noise from dark current. But it results in a uniformly
dark level that needs no post processing correction. No long exposure
dark frames are needed when making long exposures if recording raw.
The Canon 1D Mark IV, 1DX, 7D and now the 6D are excellent
sensors for low light work, with the 6D edging out the other top
performers in some cases. These cameras have good sensitivity
and low pattern noise at moderate ISOs (e.g. around ISO 1600).
But for long exposures, longer than a few seconds, thermal noise
becomes a factor in all cameras. While the thermal noise is
similar for the 6D, 1DIV and 7D when the cameras are at similar
temperatures, the 1DX has significantly higher dark current (and therefore
more thermal noise). The 6D, having some 4 times lower dark current
than the 1DX, combined with significantly lower banding noise, pushes
this camera well ahead of the 1DX and other cameras for long exposure
low light photography, including astrophotography. nightscapes, and night
cityscapes. This places the 6D top overall Canon camera for low light
long exposure photography as of this writing (among these 4 cameras),
typical in nightscapes and astrophotography. I have not included the
5DII and in this group because of the higher pattern noise at high ISOs
in that camera. I have yet to evaluate a 5D3 thermal noise.
If you find the information on this site useful,
please support Clarkvision and make a donation (link below).
If you find the information on this site useful and wish to purchase the equipment
that I use to make images like this one, please use
the links to B&H Photo to make the purchases. By using the link, you will help support
clarkvision.com at no additional cost to you. I have used B&H Photo for decades and
have always had a great experience and their prices are very good. Please support Clarkvision.
Click here to go to B&H Photo and Purchase the Canon EOS 6D DSLR Camera
Appendix 1
to be added.
Acknowledgements. A special thanks to Fabio P. Bernardino
for obtaining an extensive data set for this analysis, and to Roy Messmore
for obtaining additional thermal dark current data.
References
1)
CCD Gain. http://spiff.rit.edu/classes/phys559/lectures/gain/gain.html
2)
Charge coupled CMOS and hybrid detector arrays
http://huhepl.harvard.edu/~LSST/general/Janesick_paper_2003.pdf
3)
Canon EOS 20D vs Canon EOS 10D and
Canon 10D / Canon 20D / Nikon D70 / Audine comparison
http://www.astrosurf.org/buil/20d/20dvs10d.htm
4)
http://www.photomet.com/library_enc_fwcapacity.shtml
5)
Astrophotography Signal-to-Noise with a Canon 10D Camera
http://clarkvision.com/astro/canon-10d-signal-to-noise
Notes:
DN is "Data Number." That is the number in the file for each
pixel. I'm quoting the luminance level (although red, green
and blue are almost the same in the cases I cited).
16-bit signed integer: -32768 to +32767
16-bit unsigned integer: 0 to 65535
Photoshop uses signed integers, but the 16-bit tiff is
unsigned integer (correctly read by ImagesPlus).
The sensor analysis was done with custom, in-house written software. Raw data were
extracted from the camera raw files using DCRAW. Custom software read
that data and all processing was done in 32-bit floating point.
Disclosure
Roger Clark is a B&H Photo affiliate. The affiliate links to a product
simply allow you the ability to buy the product for the same price as if the purchase was made through
B&H directly. By using the link you support this site and enable it to
remain active with new reviews and information. Please support this site.
Back to:
Reviews Main Page.
http://clarkvision.com/reviews/evaluation-canon-6d
First published January 18, 2014.
Last updated November 30, 2014.