ClarkVision.com
| Home | Galleries | Articles | Reviews | Best Gear | Science | New | About | Contact |
Color Part 2:
Color Spaces and Color Perception
by Roger N. Clark
| Home | Galleries | Articles | Reviews | Best Gear | Science | New | About | Contact |
by Roger N. Clark
The Color Series
Introduction
Mixing Light to make Different Colors
Color Spaces
Color Spaces of TVs and Computer Monitors Maybe Are Not What You Think
The Red-Green-Yellow Problem
The Black Level Problem
The Violet Problem
The Bluest Blue
Color Perception by Wavelength
Discussion and Conclusions
References and Further Reading
This is part 2 in the series on color. Please read part 1 before this article to understand the approximations that went into CIE chromaticity and continue to propagate into color spaces. For an introduction to chromaticity, the CIE chromaticity, how it came to be, see Fairman et al. (1997) and this excellent online article A Beginner's Guide to (CIE) Colorimetry by Chandler Abraham. Basically, the CIE chromaticity diagram was created in 1931, but compromises were made. Specifically, back then the calculations were done by hand and they did not want to deal with negative numbers, so they transformed the original data into all positive response functions, assumed the transforms are linear, and this has led to approximations built on approximations built on simplifications.
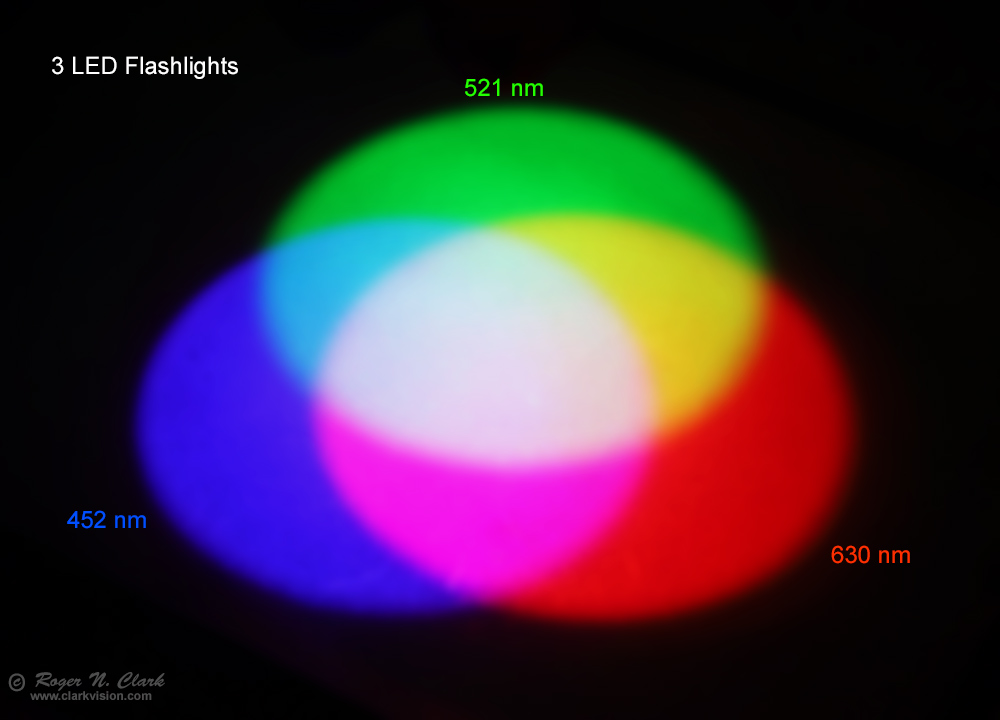
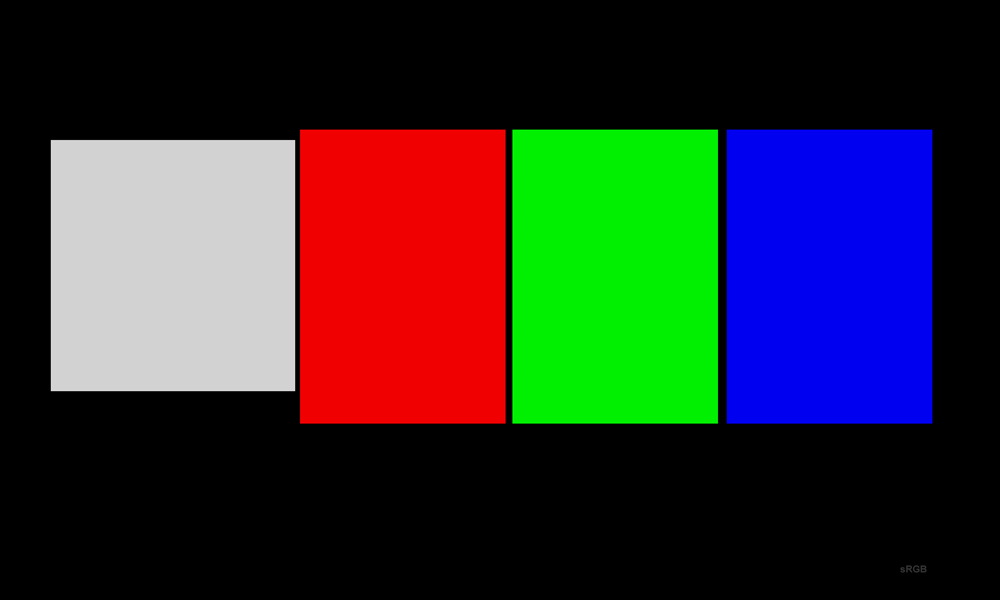
Color output from a color TV or computer monitor use a trick of the human color vision system. Using only 3 colors, many different perceived colors can be created by mixing relatively pure red, green, and blue (Figure 1). While such a simple trick can be used to make many colors, it can't make all human-perceived colors. The limitations of this model combined with the approximations of the CIE chromaticity standards will be discussed in this article.
Color we see depends on the wavelength of light. The wavelength boundaries of colors varies with the study. A web search of visible color spectral range shows quite a number of different answers. Table 1 is a summary based on a number of references, and observations of discrete spectral lines using a grating spectrometer.
    Table 1
Color       Wavelength Range   Maximum Perceived Color
ultraviolet 380 nm and lower       -
Violet      380 - 420 nm        ~400 nm
indigo      420 - 430 nm           ?
Blue        430 - 485 nm        ~440 nm
Cyan        485 - 500 nm        ~495 nm
Green       500 - 565 nm        ~530 nm
Yellow      565 - 580 nm        ~570 nm
Orange      580 - 620 nm        ~600 nm
Red         620 - 750+ nm       >630 nm
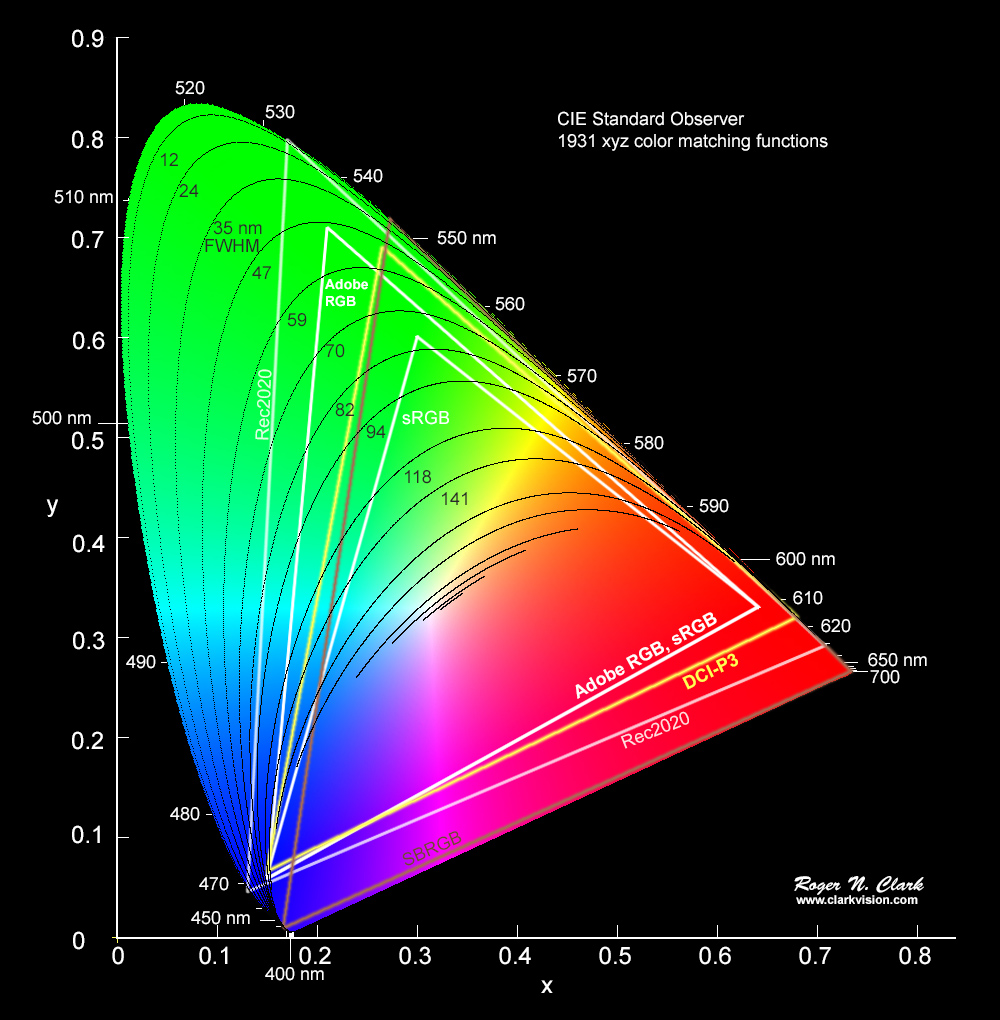
Color spaces are dictated by the boundaries of the color ranges of an imaging system or an output color device. With a typical computer monitor, three primary colors are common, a red, a green, and a blue. Other colors are made by mixing combinations of the three primaries. All colors made fall within the triangle formed by the 3 primaries on a chromaticity diagram (Figure 1 in Part 1).
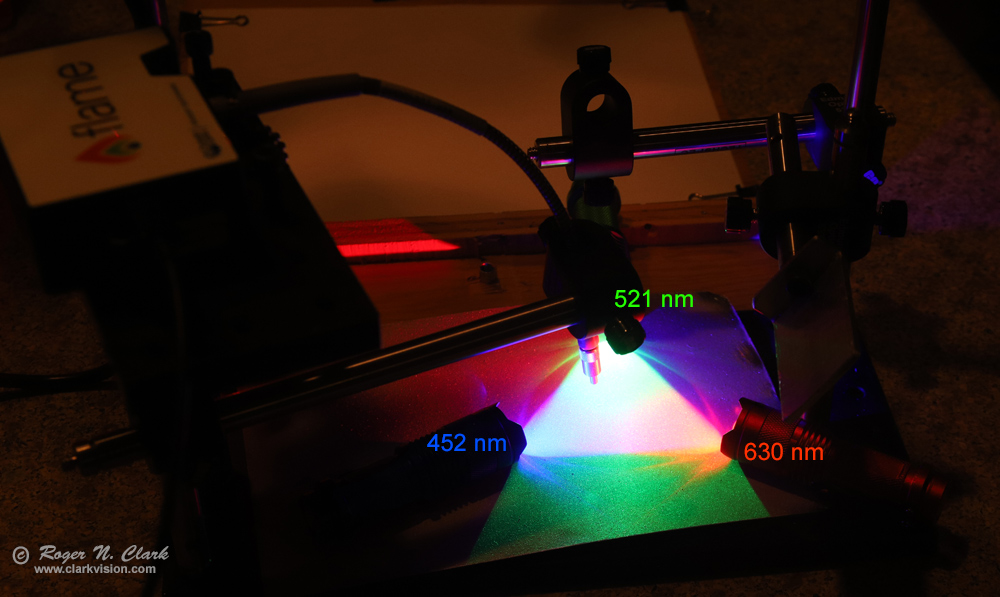
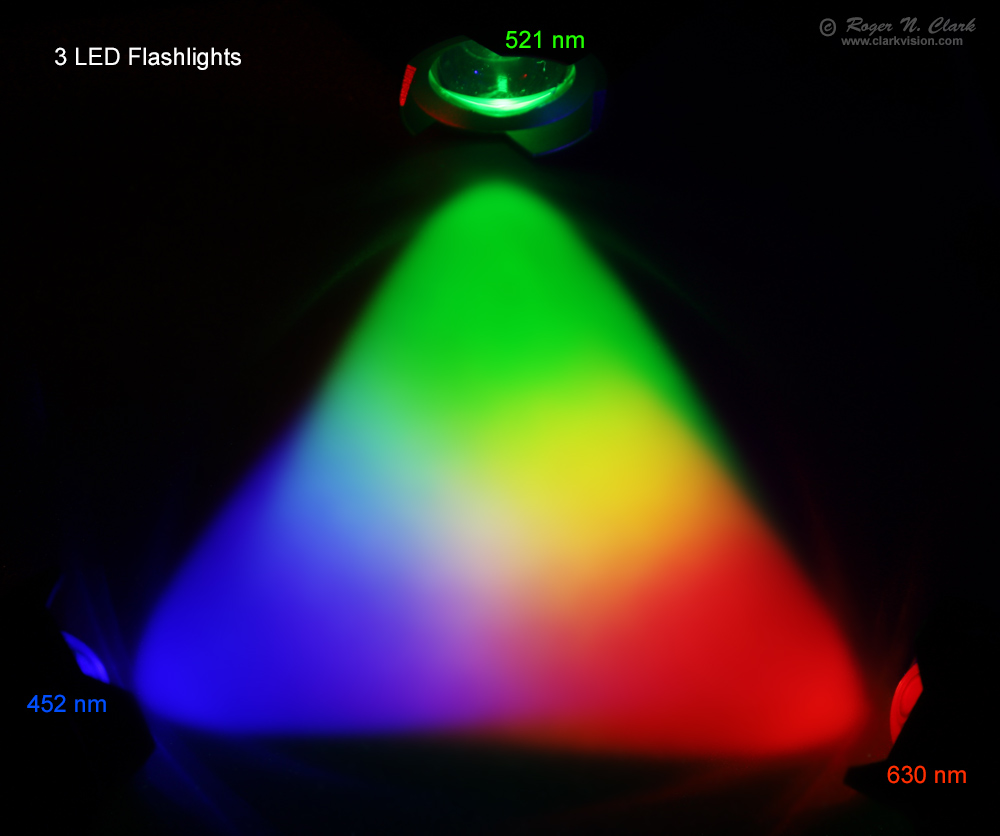
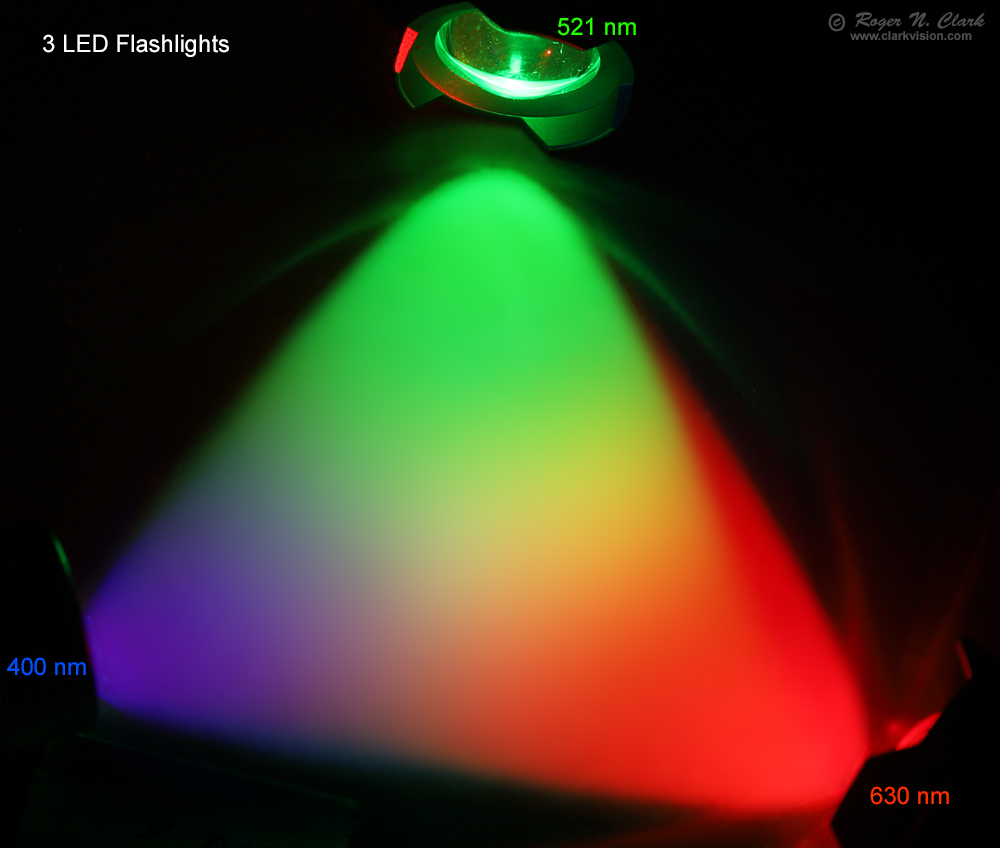
One can illustrate a color space using LED lights, for example, LED flashlights (Figure 2a, 2b). The LEDs used in Figures 1 and 2 have the following specifications with center wavelength and Full Width at Half Maximum (FWHM): Red: 630 nm, FWHM = 14 nm, Green: 521 nm, FWHM = 25 nm, and Blue: 452 nm, FWHM = 16 nm. Using the spectral profiles, the data plot on the CIE chromaticity diagram in Figure 2c.
The three flashlights used in Figures 1, 2a, 2b are:
WAYLLSHINE Red Light Flashlight (Amazon.com).
WAYLLSHINE Green Light Flashlight (Amazon.com).
WAYLLSHINE Blue Light Flashlight (Amazon.com).
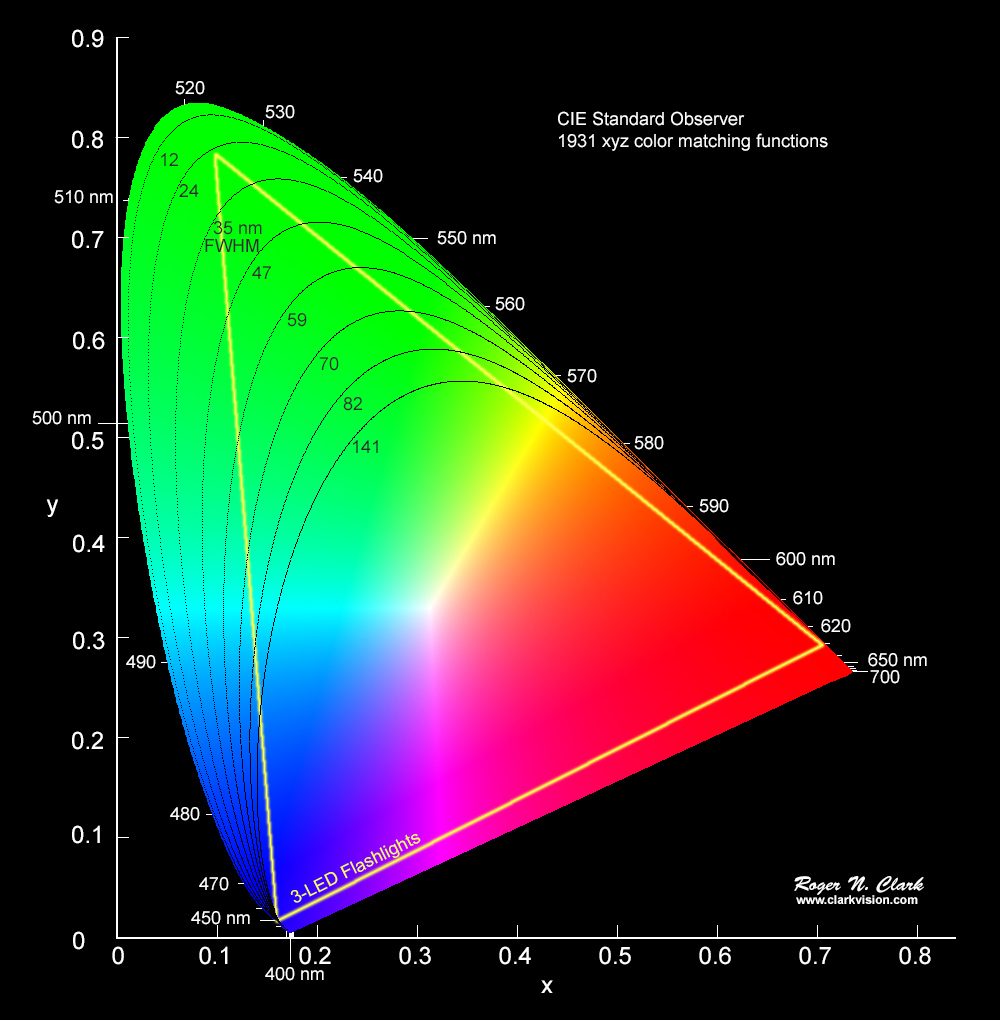
The colors that the display device can output all fall within the triangle (e.g. Figure 2c) for a given color space. It should be clear from Figure 2c that the triangle formed by three primaries can not describe all colors perceived by humans with normal vision. Further, the CIE model does not describe violet, which is a distinct spectral color ignored by the 3-primary color space models.
Another complicating factor with color spaces that we will see below, is that for a given device, like a computer monitor, even though an image is presented in a given color space, the output color many not actually be in that color space and within the boundaries of the color space! This is not common knowledge. The reason for this discrepancy is that the spectral profiles, e.g. of the LEDs in an LED monitor, have the wavelength and bandwidth of the LEDs fixed, regardless of the color space of the image. This impacts the colors people see on their monitors, and despite an image being in a specific color space the actual displayed color will be different, even when the monitor has been calibrated. For example, the image in Figure 2c, above, is in the sRGB color space. But how blue the blues appear, how red the reds appear, and how blue the blues appear will be dependent on the specific model of the monitor one views the image on.
We have seen that three primary colors can be used to define a triangular region on a chromaticity diagram, as in Figure 2c. Any three such primaries make up what is called a color space, though color spaces with more than 3 colors are also possible. Any color outside the straight lines connecting the primaries is called out of gamut, and the colors inside the boundary are the gamut of the color space. The primaries used in some common color spaces are given in Table 2.
           Table 2.  Color Space Primaries

Color Space      Red primary   Green Primary   Blue Primary
                    (nm)           (nm)           (nm)
Rec 2020            630            532            467
Adobe RGB           612            535            465
sRGB                612            549            465
DCI-P3              615            544            465
Stiles and birch    700            546            436

Approximate Bandwidths (FWHM):
                 Red primary   Green Primary   Blue Primary
                    (nm)           (nm)           (nm)
Rec 2020              1              1              1
Adobe RGB          large            50            130
sRGB               large            80            130
DCI-P3                1             50            130
Stiles and birch      1              1              1

Large means any bandwidth, FWHM, up to a hundred nm or a little more.
For example, consider the Adobe RGB color space (Figure 3), commonly used by photographers. The primaries are: red = 612 nm, green = 535 nm, and blue = 465 nm (Table 2). Note that the red and blue primaries are the same for both Adobe RGB and sRGB. The contours in Figure 3 illustrate the limitations for producing pure color. The green triangle point for Adobe RGB occurs for a bandwidth (FWHM) of about 50 nm. That is quite narrow and green is a particularly difficult color to produce with LEDs. It is commonly made by a phosphor that emits a broader spectrum. Thus, it is currently difficult to make an LED or LCD monitor that reaches beyond the Adobe RGB green apex and blue apex in the specification. On the other hand, reds are less dependent on the bandwidth of the light source because the FWHM contours are very close together in the red. The contours are also close in the blue but not as close as in the red. Given the spectral output of the 3 color channels of a display device, the bandwidths and central wavelengths can be plotted on the chromaticity diagram and the vertices of the color space for the device can be shown without the need for extensive chromaticity measurements.
Some emission devices, including LEDs in TVs and monitors do not have simple Gaussian shaped spectral profiles and then an integration over the spectral profile must be computed.
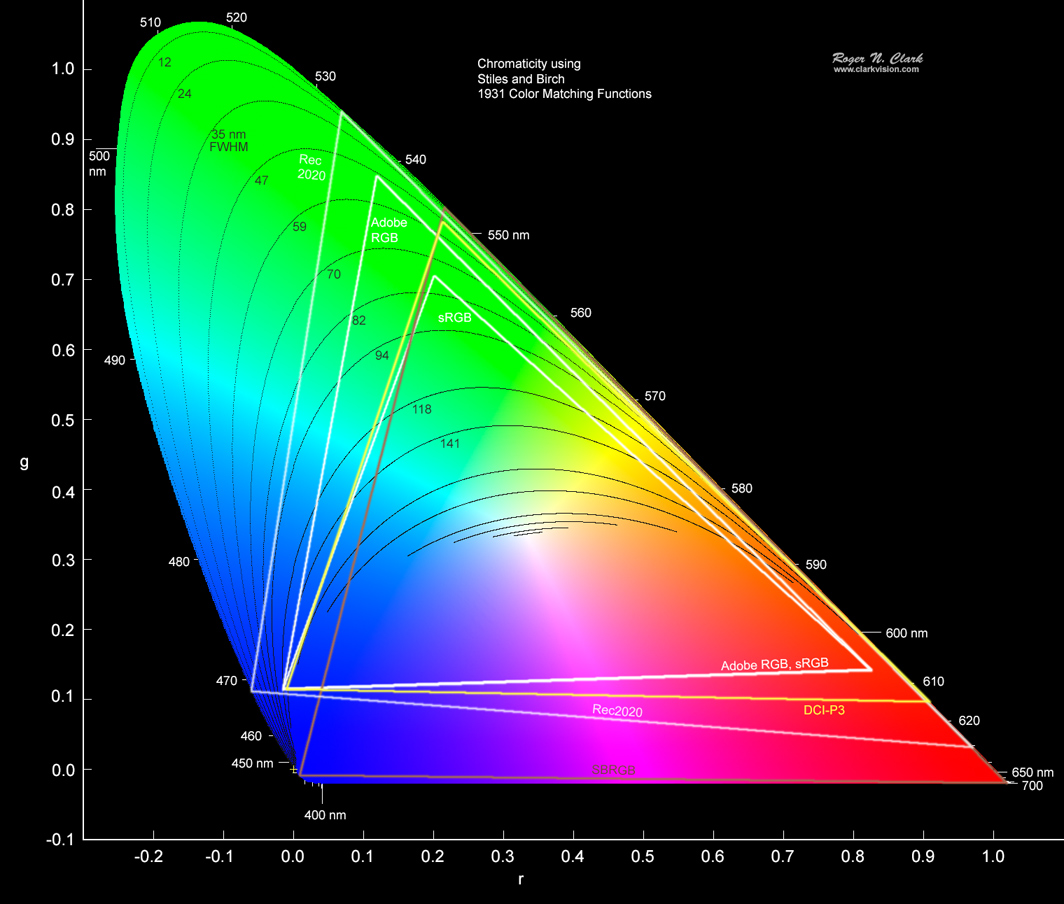
We have seen in Part 1 of this series that the CIE chromaticity is approximations build on simplifications. Better would be to use Stiles and Birch chromaticity. The color spaces in Figure 3 are shown plotted on Stiles and Birch chromaticity in Figure 4.
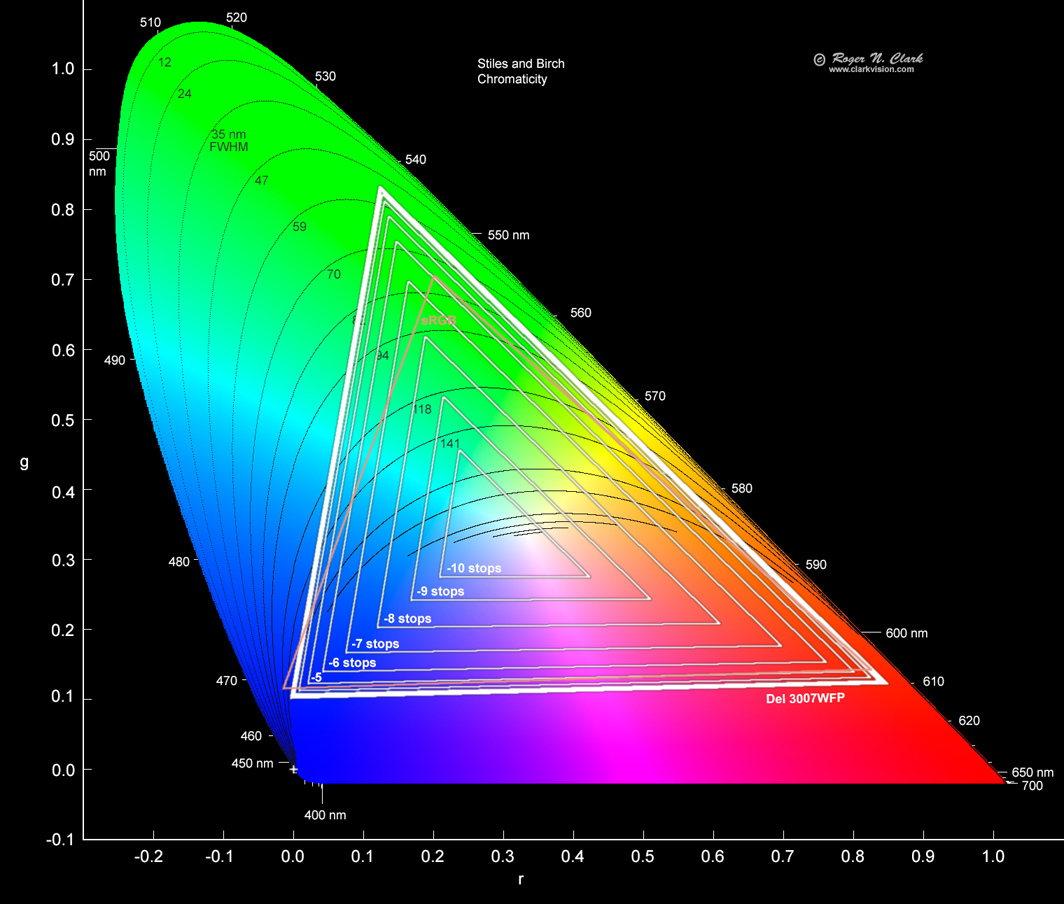
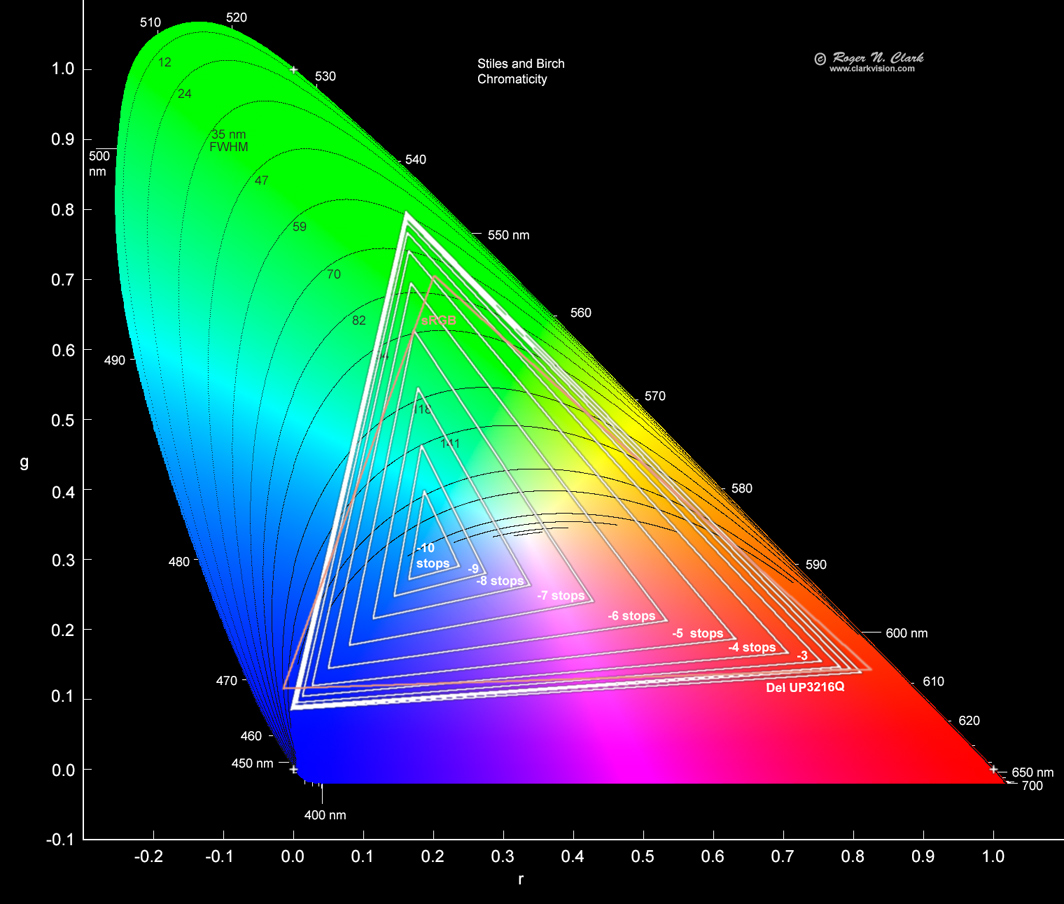
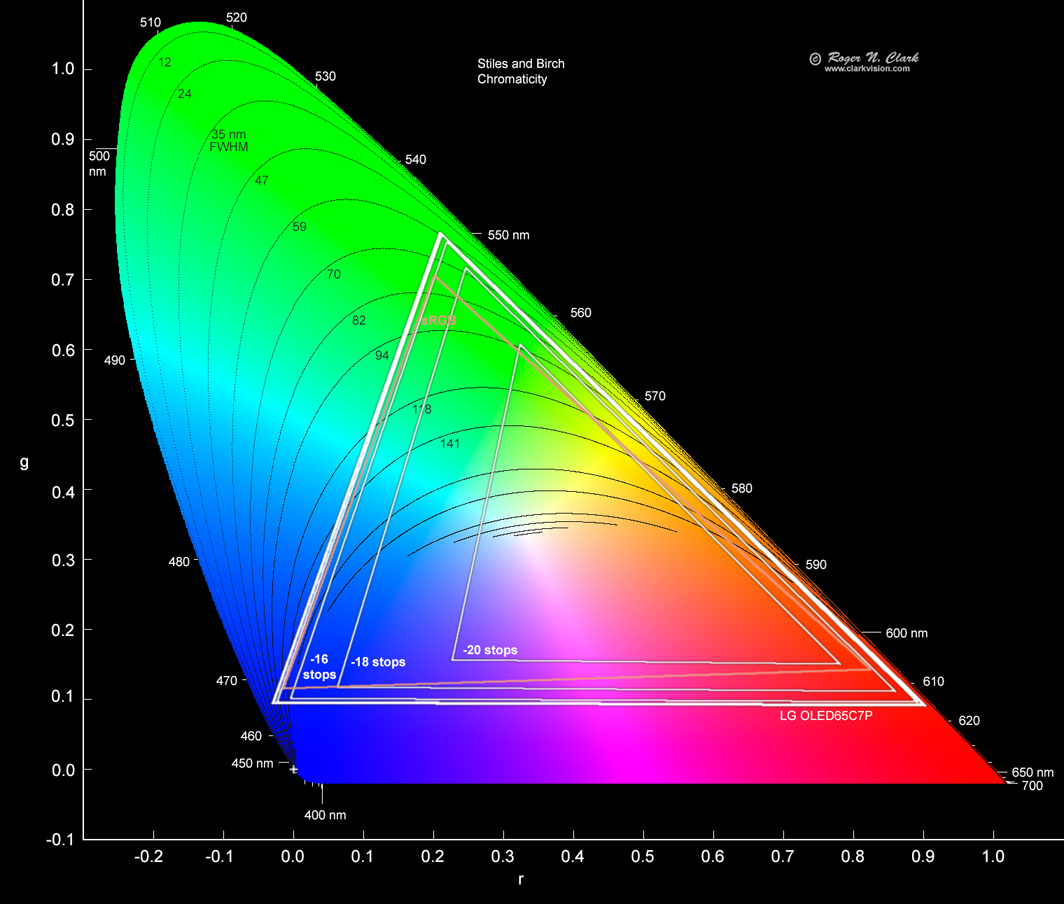
Using a spectrometer, I have measured the output of TVs and computer monitors. Some examples are shown in Figure 5 - 9. Note that the response functions are not simple Gaussians, but have significant response at wavelengths where a Gaussian would have a lower response away from the peak of each response function. This "out-of-band" response dilutes the purity of the color and reduces the color gamut of the device. The gamut outline for the devices in Figures 6a, 6b, 7a, 7b, 8a, and 8b are plotted on Stiles and Birch chromaticity in Figure 10.

There are several fundamental concepts that the data in Figures 6 - 10 illustrate. The measured spectral response for the OLED TV and computer monitor used sRGB images constructed in photoshop. One might think that the data should plot inside or on the sRGB triangle in Figure 11. The data do not because the spectral response of the devices are fixed. The Del 3007WFP-HC covers about 97% of the Adobe RGB gamut, and the data in Figure 11 are consistent with that value, but also covers bluer blues and redder reds than Adobe RGB. The LG OLED TV is aimed at covering the DCI-P3 gamut and comes very close, and also has bluer blues than the standard, and very slightly greener greens. Despite using the same sRGB image, the two displays show the greens and blues with different hues because of the different output spectral profiles of the LEDs. Same with the other monitors plotted above.
Color managed software that includes an icc profile for the monitor may mitigate the out of gamut color, but most software does not, and those that do will only do so if you install the monitor icc profile. And depending on the spectral response function, it may not be possible to add different channels together to make a color within the gamut (e.g. sRGB gamut). This problem is described below in the section on Color Space Conversions.
The spectral profiles for the 3 display devices in Figures 6-8 are shown grouped by color channel in Figures 10a (red channel), 10b (green channel), and 10c (blue channel). Now we can see the relative color response of each display. Important for spectral purity is a low output away from the color of the color channel. For example in Figure 10a we see that for the red channel, the OLED monitor shows lower green and blue output than the other displays. Same with the blue and green channels (Figures 10b, 10c).
Color Space Conversions. When you change from one color space to another, ideally the output device would shift wavelength and bandpass of the primaries to the new color space, but that is not possible with current technology. What could happen, however, is that signals from one or both other primaries could be added to a given primary to shift the chromaticity toward the position of the new color space. For example, the driver for the OLED TV could add some green to the blue channel to move the OLED TV blue apex to the upper right (toward green) in Figure 11. But the Del blue apex does not fall on a line from the measured blue chromaticity to the blue apex of sRGB or Adobe RGB toward a green or red primary. To move the Del monitor to Adobe RGB or sRGB would be a compromise. To do such conversions, a profile of the monitor is needed and all viewing software would need to use that profile and apply it. That is currently not done in most software. As a result, one can nt be certain of the exact color displayed on different monitors even if everyone had color calibrated monitors.
Converting Adobe RGB to Rec 2020 would involve moving the blue apex to the left, which means subtracting red from the blue channel, and subtracting both blue and red from the green channel. This can result clipping RGB data to zero and I see this happen in real image data if I try and convert certain images from Adobe RGB to Rec 2020 in photoshop.
Another problem with converting color spaces is that it is an approximation. Take an image and convert to a different color space, e.g. in photoshop, and then convert back to your original color space. If the conversions were exact, the color values would be exactly the same as the original. But they are not, and sometimes quite different, especially for colors near the primaries. Plus, as we saw in part 1, that CIE chromaticity is based on approximations, so converting color space is adding another approximation.
What all this means is that when a computer or TV is presented with image data, regardless of the color space marked with the data, the output device does not change the wavelengths of its output, and software might compromise the color. This means that the same image when viewed on different monitors could show colors with different hues despite being the same image with a defined color space. For example, a wide gamut monitor might show redder reds, greener greens and bluer blues than called for in the sRGB gamut, and that is demonstrated in the example data in Figures 6 - 9. Similarly, a monitor that just covers the sRGB gamut can not show colors beyond what the monitor spectral characteristics indicate, thus, it can not show Adobe RGB colors outside the gamut of the device, despite converting to Adobe RGB. That same image can look different when viewed on a wide gamut monitor. The effects on color are more prominent in the green and blue.

Another important factor in maintaining color over a large brightness range is the black level. As seen in Figure 6b, the black level of an OLED display is very low compared to the black levels on LED computer monitors (Figures 7b, 8b). QLED monitors (Figure 9b) are also better than older LED technology, but contrast and gamut depends on the brightness of other objects on the screen. For darker scenes, the black level on OLED and QLED are so low that the black level does not influence the color except if lights in the viewing room are reflecting off the display. As components on the scene become brighter, OLED shows better dark colors than QLED. Compare that to the back levels in Figures 7b and 8b for standard LED/LCD monitors. As scene intensity drops, colors will shift to grey with that technology, or shift to the color of the black level with loss contrast and saturation. Blacks will look grey or a pastel color, not black. The black level also shifts the color gamut of an image as scene intensity drops (Figures 12a, 12b, 12c, 12d). The loss of color and contrast reduces the realism of an image, and the image looks flat compared to a real scene, or the same scene viewed on a monitor with a lower black level.
The first impression I had of OLED was the colors were too saturated, but that was from my comparison of the loss of saturation from decades viewing computer monitors that lose saturation and contrast as scene intensity drops. The OLED with true blacks show more natural images, with QLED a close second.
Dynamic range of a display device comes from two levels: the brightest brights, and the dimmest darks. Standard LCD/LED displays have on the order of 400 to 1000 dynamic range (examples in Figures 12a, 12b). Viewing the same jpeg image on a standard LED monitor and on an OLED is a world of difference. I now review all my images on an OLED or QLED display before I produce my final edit. I see things in images on an OLED/QLED display that I could never see on standard LCD/LED displays, and the colors in the dark parts of images are richer because there is no loss of color gamut.

The chromaticity diagram indicates a nice yellow might be derived from red and green primaries, but narrow-band primaries do not combine well to produce a pure yellow. Yellow is also a distinct spectral color. This is known as the Red-Green-Yellow Paradox (Bangert, 2015). While one can use red and green LED flashlights to make a yellowish color, the perceived color is not the pure yellow of a narrow yellow emission line. The LED flashlights used in Figures 1 and 2 are narrow enough in wavelength to see this effect.
It seems logical that given the CIE chromaticity diagram or the Stiles and Birch chromaticity diagram one might make a larger color space by using colors near the apexes of the chromaticity. For example, 400 nm for blue, 515 nm for green , and 700 nm for red. I came close to this by using flashlights, the red and green from the above study, 630 and 521 nm, but substituting 400 nm (violet) for blue (Figure 13).
There appears to be no cyan or magenta with using a 400 nm LED flashlight with 2 primaries. But interestingly, there is no blue created either! Violet (400 nm) is a distinct spectral color, and violet + green does not produce other colors like blue and cyan. So there are limits to the colors that can be created with 3 primaries.
Experiment yourself with these red, green and UV flashlights (the same red
and green flashlights were listed above):
WAYLLSHINE Red Light Flashlight (Amazon.com).
WAYLLSHINE Green Light Flashlight (Amazon.com).
UltraFire Black Light UV Flashlight (Amazon.com).
TFSeven Mini 395-410nm UV-Ultraviolet Led Blacklight Flashlight (Amazon.com).
What is the bluest blue? From Table 2 and Figures 3 and 4, we see blue primaries ranging from 435.8 nm to 467 nm. The bluest blues that I perceive are in the 430-440 nm range, and 467 nm is distinctly less blue, moving toward cyan. High altitude clear blue sky peaks at even shorter wavelengths. LEDs commonly have a peak emission near 450 nm, so why choose 465-467 nm for common color spaces? Note that the spectra in Figures 6 - 9 have a peak blue response at 447 to 456 nm, and only show slightly higher chromaticity wavelengths because of the significant spectral response near 500-550 nm. As manufacturing improves, we might see better 450 nm spectral profiles and the color space of the devices move toward 450 nm and deeper blues will be seen.
The bluest blue powder: YInMn Blue.
The 436 nm emission line of a mercury emission light (see Figure 14) was the blue line used by Stiles and Birch in their chromaticity study. Perceptually, this emission appears as a brilliant blue, again pointing to 430-440 nm as the bluest blue. However, as we age, the transmission of the lens in our eyes absorbs more blue, the lens transmission looks more yellow. So older people may not see short wavelengths like 436 nm emission very well, and in that case, a longer wavelength may appear as a better blue. If you have had cataract surgery where the lens is replaces with a plastic lens, blue transmission is improved, similar to that in young people. So the bluest blue is age dependent/cataract surgery dependent.
By using a spectrometer to separate the wavelengths of light, one can visually study the color perception for different wavelengths. A challenge is visually identifying specific wavelengths to correlate with computed colors and colors imaged by a digital camera. This is made simpler by using a light source with emission lines. A common light source for this is a compact fluorescent light. The emission lines are due to mercury, terbium, and europium (see Fluorescent lighting spectrum peaks, wikipedia. The colors of the spectral lines are indicated in Figure 14.
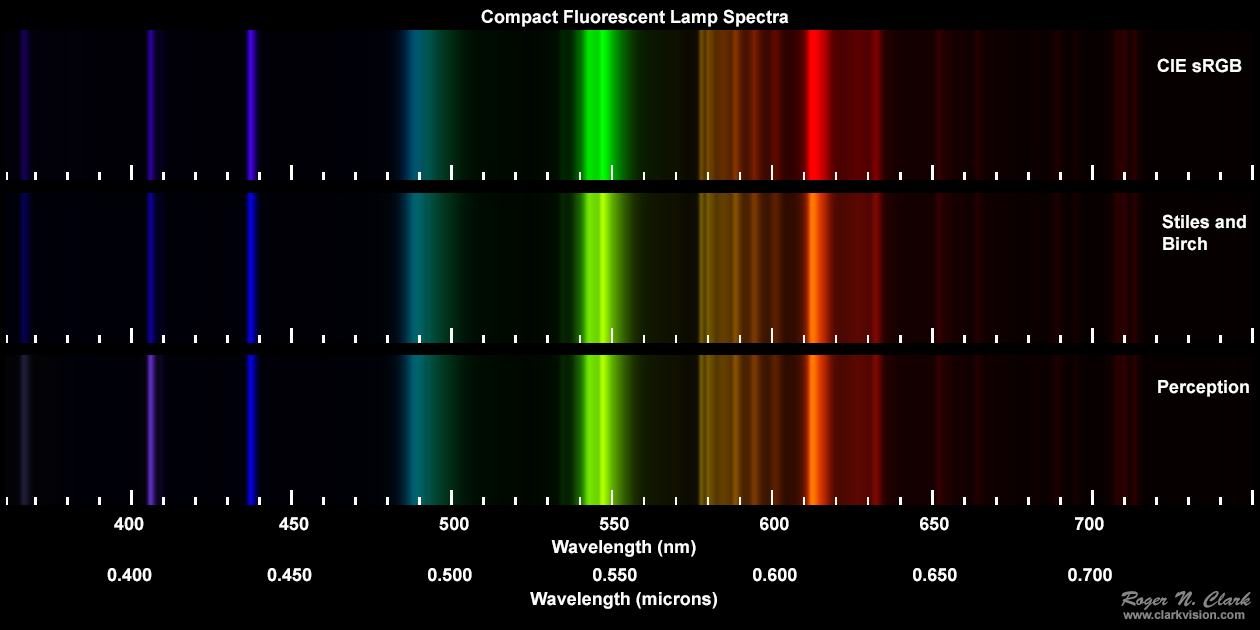
Note that the colors of sRGB do not match the perceived color, but Stiles and Birch match from 430 nm to beyond 650 nm. In fact, the values are the same in the Stiles and Birch and Perception spectrograms in Figure 14 because I could not see any perceptual difference within the limits of the LED computer monitors tested. There were significant differences in the UV.
The blue line at 436 nm is slightly purple in the sRGB spectrogram in Figure 14 but does not appear purplish to my eyes. The teal near 490 nm is the closest between sRGB, Stiles and Birch, and perception. The green (540-590 nm) is greener in sRGB, but visually appears a distinct yellow green, again sRGB is off from perceived color (so is Adobe RGB). The 612 nm line appears red-orange, but sRGB (and Adobe RGB) shows it redder. Adobe RGB gives the same blue and red color because the primaries are the same (Table 2). The greens near 550 nm appeared the same between Stiles and Birch and perception, but sRGB (and Adobe RGB), comes out greener. Some online converters show the 612 nm color closer to the perceived red-orange, likely due to the use of a different approximation matrix than given by Bruce Lindbloom.
We have learned in part 1 that CIE chromaticity is based on simplifications and approximations, and that will drive CIE colors to be different than perceived colors, especially with more complex spectra with narrower wavelength response functions. Color spaces are another approximation, and the perceived colors between two monitors can appear different due to the output spectral profiles of the RGB color channels.
The exact color and differences from perception will depend on the spectral profiles of the output media, as well as the approximation matrix used for conversion between color spaces. Color calibration can not completely compensate for differences because the output spectral profiles are fixed. For example, the LED spectral profile of a TV or computer monitor, e.g. Figures 8 - 9 are fixed in wavelength and bandwidth.
The Adobe and sRGB color spaces have a red primary that is actually red-orange, not red. The blue primary is also not a very deep blue. The DCI-P3 color space, common circa 2017-2019, have a better red primary but a similar blue primary as Adobe RGB and sRGB. DCI-P3 green is not as green as in Adobe RGB. The Rec 2020 color space significantly improves the red and green primary, but changes little in the blue primary, which is still not a very deep blue.
What dose this all mean? Color, even with the CIE standards is more variable from device to device than the standard might imply. The CIE color standards are not a perceptual standards--they are device standards. While a CIE chromaticity may be a common standard and produce a given chromaticity from a given spectrum, that chromaticity will vary depending on which color matching function is used, and which approximation matrix is used to convert XYZ to xy chromaticity. And even when the chromaticity is calculated for a given set of equations and models, the actual color output by a device like a computer monitor or TV will vary depending on the spectral profiles of device. This will likely be similar for two different computer monitors that were both high gamuts that are close to filing a given color space, like Adobe RGB. But the colors, especially greens, will likely appear different between computer monitors with different inherent color spaces, like one with Adobe RGB and another with sRGB.
If you want to produce true perceptual color, it is best to use the original Stiles and Birch 1931 Color Matching Functions, displayed on a wide gamut computer monitor or TV. For closest perceptual colors, the Stiles and Birch results can be fine tuned by hand. This is needed especially for UV wavelengths where none of the color models do well.
Not discussed here, but another major factor in color accuracy and contrast is off-angle response. I have reviewed specifications and viewed many TVs/monitors and find that in my testing so far, only IPS panels and OLED have excellent off-angle response (the two Del monitors shown here are IPS monitors), with the 2019 Samsung QLED acceptable. Cheap 4K TVs and monitors generally have poor off-angle response. LG's nano-LED, a competitor to Samsung's QLED, has poor off-angle response in the 2019 models I tested.
Circa 2015+, the television display technology is being driven by the video industry moving to Ultra High Definition (UHD) 4K and 8K content with High Dynamic Range (HDR) output and the Rec 2020 color space. The older technology of High Definition (HD) with Standard Dynamic Range (SDR) is based on Rec 709, close to sRGB color space. The Rec 2020 is still difficult to reach with current technology (2019) so we see more TVs and computer monitors with DCI-P3 color space coming out. DCI-P3 has similar blues, better reds, but not as deep greens as Adobe RGB, and that will impact the colors perceived in images, even if you use Adobe RGB color space in your work flow.
All this means that when you produce an image for others to see, e.g. on the web, what colors they actually perceive will depend on the display device they are using, despite any declared color space to the image. Another factor in color perception is contrast. Some display technology, like LCD and LED Tvs and computer monitors have black levels that are not true black, and include light at all wavelengths. That dilutes the spectral purity, reducing apparent saturation. This low light level is not just in black areas of an image, it is light also contributing to the bright areas of an image, reducing apparent color saturation. Newer technology, like OLED displays have blacker blacks, so colors appear more saturated, even with the same image data, greatly improving image impact. This issue is shown in Figure 6 - 7 where we see the the curves for the OLED display (Figure 6a) are close to zero away from the peak response compared to the LED monitor in Figure 7. That small difference is a large factor with the logarithmic response of our eyes. For example, compare the log plots of Figures 6b and 6b to the linear plots of Figures 6a and 7a.
Blue and violet colors and color perception will be discussed in more detail in a future part of this series.
A Beginner's Guide to (CIE) Colorimetry by Chandler Abraham.
Bangert, T., 2015, Colour: an algorithmic approach, PhD. Thesis, Queen Mary University of London. http://www.eecs.qmul.ac.uk/~tb300/pub/PhD/stage2Report.pdf
CIE 1931 color space, wikipedia.
On the Hunt for Indigo: the Bluest of Blues, 2014, projectbly.com.
Evans, P. K., 2016, The Bluest Blue structuralcolour.org.
Fairman, H. S., M. H. Brill, and H. Hemmendinger, 1997, How the CIE 1931 Color-Matching Functions Were Derived from Wright-Guild Data, Color Research & Application, CCC, 22 p. 11-23. https://pdfs.semanticscholar.org/02fc/45b219c53ca71d24a2ddcea1227c4e4a3703.pdf
Gegenfurtner, K. R., and D. C. Kiper, 2003, Color Vision, Annu. Rev. Neuroscience 26 p. 181-206.
Kokaly, R.F., R. N. Clark, G. A. Swayze, K. E. Livo, T. M. Hoefen, N. C. Pearson, R. A. Wise, W. M. Benzel, H. A. Lowers, R. L. Driscoll, and A. J. Klein, 2017, USGS Spectral Library Version 7 Data: U.S. Geological Survey data release, https://dx.doi.org/10.5066/F7RR1WDJ. https://speclab.cr.usgs.gov/spectral-lib.html
Masaoka, K., Y. Nishida, and M. Sugawara, 2014, Designing display primaries with currently available light sources for UHDTV wide-gamut system colorimetry, Optics Express, 22 DOI:10.1364/OE.22.019069.
Masaoka, K., and Y. Nishida, 2015, Metric of color-space coverage for wide-gamut displays, Optics Express, 23 DOI:10.1364/OE.23.007802.
Witzel, C., and K. R. Gegenfurtner, 2013, Categorical sensitivity to color differences, Journal of Vision 13, p. 1-33.
Witzel, C., F. Cinotti, and J. K. O'Regan, 2015, What determines the relationship between color naming, unique hues, and sensory singularities: Illuminations, surfaces, or photoreceptors? Journal of Vision 15, p. 1-32.
Witzel, C., 2015, What are the fundamental differences between color space and color model? researchgate.net https://www.researchgate.net/post/What_are_the_fundamental_differences_between_color_space_and_color_model
The Color Series
| Home | Galleries | Articles | Reviews | Best Gear | Science | New | About | Contact |
http://clarkvision.com/articles/color-cie-chromaticity-and-perception
First Published May 23, 2019.
Last updated December 20, 2020