Exposure Time, f/ratio, Aperture Area, Sensor Size, Quantum Efficiency:
What Controls Light Collection?
Plus Calibrating Your Camera
by Roger N. Clark
There is much confusion on the internet in the photography world about light collection.
Light collection is important because light makes the image and more light
results in images with less apparent noise.
We read online that larger sensors collect more light, and f-ratio is the key
to collecting light. These concepts apply to a very restricted situation and are
only correlations, not causation.
Aperture area and exposure time are the keys to collecting light.
In this article I'll show examples why aperture is key and the sensor size
and f-ratio concepts fail. There are simple equations that describe
all situations. I'll distinguish between correlation and causation
regarding which factors actually control light collection.
This knowledge will help photographers make better decisions in low light situations.
The Night Photography Series:
Contents
Introduction
A Milky Way Example
A Moon Example
Light Collection from a Cheetah on the Serengeti
Distance and the Inverse Square Law
Photon Rain Analogy
Correct Model of Light Collection
Equations for Light Collection
How Does Equation 5 Agree with Astronomical Photography?
How Does Equation 6 Agree with Terrestrial Photography?
Predicting Light Collection: by Applying the Equations
Light Collection: F-ratios vs Aperture
Per Pixel Level Signal Detection Controversy
Discussion and Conclusions
The Apple Pie Analogy and what this all means
Appendix: Calibrate Your Camera
Steps to Calibrate a Camera + Lens/Telescope
Example Calibration with the Moon
Finding Camera Gain
Getting the Linear Camera Raw Data Values.
Getting Omega, the Object's Solid Angle
Calibrating Using Stars
References and Further Reading
All images, text and data on this site are copyrighted.
They may not be used except by written permission from Roger N. Clark.
All rights reserved.
If you find the information on this site useful,
please support Clarkvision and make a donation (link below).
Introduction
In low light situations, photographers often want to know what equipment
and settings to use to collect enough light to make compelling images.
One can read on the internet that "larger sensors collect more light"
and "faster f-ratios collect more light." In special cases these
statements can be true by correlation but neither statement is universally true,
nor do they describe the correct fundamental parameters that are actually
responsible for collecting the light. So what are
the true factors in light collection? First we must separate causation
from correlation. It is correlations that confuses many and that can
lead to poor selection of equipment and settings. Understanding the
fundamental parameters, the causation, that collects light leads one to
make better images in difficult lighting situations.
Here, I will show example images with different lenses and sensor sizes
where I have measured the number of photons collected. I derived the
amount of light in photons by analyzing the linear raw data and the
known camera sensor gains to convert raw file Data Numbers (DN) to photons. I use
astronomical objects because professional astronomers have calibrated
their brightnesses, thus enabling any photographer to calibrate their
camera systems to absolute light levels.
On this page you will see references to the exposure factors CEF and CEFA. See
section
4b1) Astrophotography and Exposure for details.
Quickly, CEF defines the light collected from an object with results
given in minutes-cm2, where the minutes come from the
exposure time, and the cm2 is the area of the aperture
collecting the light (technically the entrance pupil). CEFA is given
in minutes-cm2-arc-seconds2 where the additional
arc-seconds2 is angular area and can be the angular area of
a pixel. Don't worry if this is confusing at this point. But do note
that there is no sensor size and no f-ratio in these equations.
In photography, we learn that a photographic stop, or simply, a stop is a
factor of 2. Specifically a change of 1 stop in the lens is a factor of 2
in the lens aperture area (technically the entrance pupil area). One stop regarding
exposure time is simply a change in exposure time by a factor of two.
Now consider an object, like the Moon, or a bird in a tree, both
illuminated by the sun. Both reflect light toward you and your camera.
Each will reflect a certain number of photons per square centimeter onto
the lens of your eye and the lens of your camera. It is this a basic
concept that the greater the diameter of the lens, the greater the lens
aperture area, so more square centimeters, so more light gets collected
by the lens.
Let's see how this works in the following examples. These examples will expose
flaws in some models for light collection and shine the proverbial light
on the real parameters for light collection.
A Milky Way Example
The Milky Way is shown in Figures 1a through 1d. By the ideas of
photography, the 120 second exposure at f/2.8 (Figures 1a, 1d) should
deliver the same amount of light as the 30-second exposure with an f/1.4
lens (Figures 1b, 1c). But that is not what was found. Despite shorter
exposure times and smaller field of view, the amount of light collected
from the Milky Way increased from 1a to 1b and again for Figure 1c and
increased yet again in 1d. One might also think that the 120-seconds
at f/2.8 in Figure 1a and the 120 second exposure at f/2.8 in figure
1d would collect the same amount of light if the prevailing "rules"
of photography universally applied. Some internet experts advocate the
use of a wider angle lens to collect more light from the Milky Way
but the Figures 1a-1d prove this is idea is false. Other internet experts
have said that one would get the same amount of light from the Milky Way
(or other objects) for the same f-ratio and exposure time combinations. Again,
Figures 1a - 1d prove that idea is incorrect.
Another method of calculating light collection advocated by another
"internet expert" is (t = exposure time):
light collection ∝ t * sensor_area / (f_ratio)2 (equation 1)
Because the exposure times and sensor areas are the same in Figures 1a
and 1d, equation 1 says the light collected should be the same because
the f-ratios and exposure times were also the same on the same sensor.
The image in Figure 1a collected 1.46 billion photons, while the one in
Figure 1d collected 4.31 billion photons. Clearly equation 1 fails.
Despite the same settings, f-ratio, exposure time and sensor size,
the two images recorded a factor of 3 difference in total light with
the longer focal length lens collecting more (Figure 1d).
Not only does each longer focal length lens in Figures 1a through 1d
collect more light in total, the trend to collect more light from a star
or other objects in the frame also increases. The image in Figure 1b
collected 5.4 times more light from each star in the frame than in Figure
1a, and recorded stars 2 stellar magnitudes fainter (6 times fainter).
The image in Figure 1c collected 9 times more light from each star in
the frame than in Figure 1b, and recorded stars 1.5 stellar magnitudes
fainter (4 times fainter). The image in Figure 1d collected 8 times more
light from each star in the frame than in Figure 1c, and recorded stars
1.6 stellar magnitudes fainter (4.6 times fainter). And, finally, the
image in Figure 1d collected 400 times more light from each star in the
frame than in Figure 1a, and recorded stars 5.1 stellar magnitudes fainter
(110 times fainter), despite having the same exposure time and f-ratio!
Clearly, there are flaws/limitations in the f-ratio or sensor area ideas of collecting light.
But do note, that the example in Figures1a-1d also changes field of view,
and for an object (the Milky Way in this example) that is not uniform in brightness,
different portions of the Milky Way have different stars and nebulae.
Indeed, if we did this test using a flat, featureless wall illuminated
by the Sun, the results would be different. In that case we would
expect that the light collected with each lens and the exposure times
and f-ratios in Figures 1a-d, we would see the same amount of light in
each frame. It is this idea of where the f-ratio and exposure concepts
came from. But it strictly applies only to uniformly lit, featureless
objects filling the frame. As focal length increases with the same
f-ratio and sensor size, a smaller area of the wall fills the frame, but
the lens aperture area increases compensating for the smaller area of the
field of view.
With the two balancing for uniformly-lit, featureless scenes, we get this concept of constant
f-ratio = constant light, but that applies ONLY to featureless, uniformly
lit scenes!
So while true in the one case, the f-ratio idea does not universally apply
in the real world. Fortunately, the real world is much more interesting.
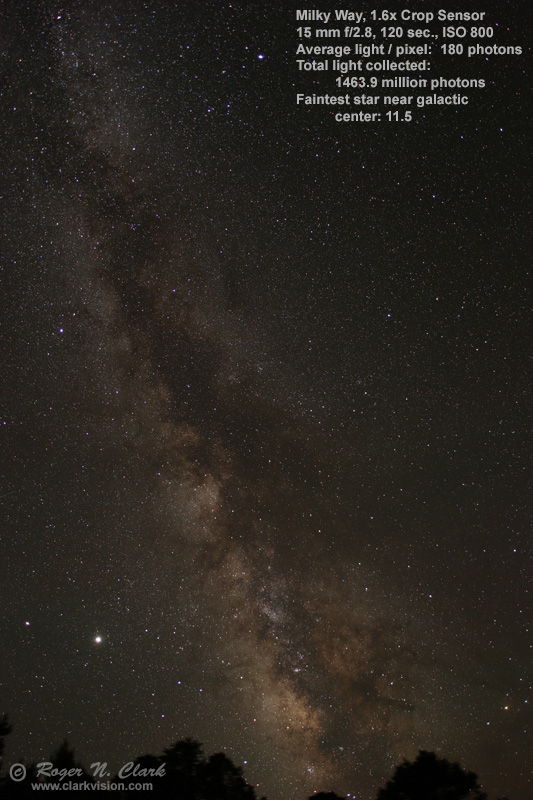
Figure 1a. The Milky Way imaged with a Canon 90D 1.6x-crop camera and 15 mm f/2.8 lens.
CEF = 0.45 minutes-cm2.
CEFA = 873 minutes-cm2-arc-seconds2 (44 arc-seconds/pixel).
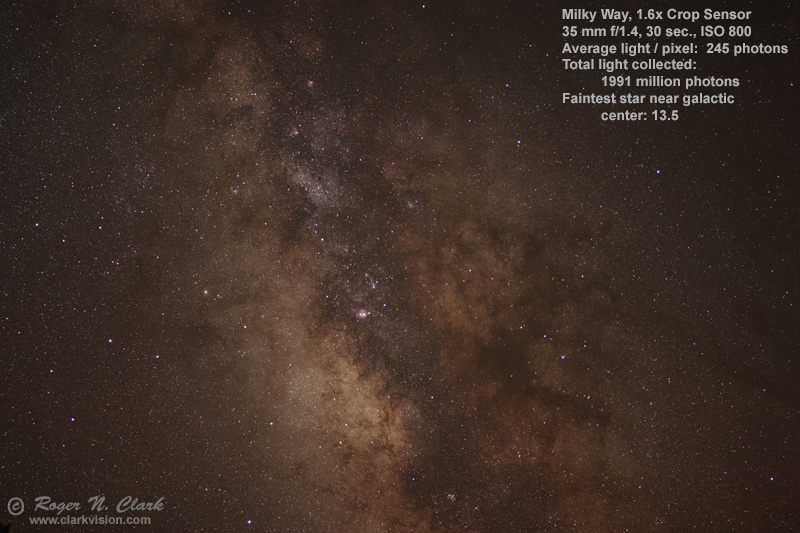
Figure 1b. The Milky Way imaged with a Canon 90D 1.6x-crop camera and
35 mm f/1.4 lens.
Despite a smaller field of view, the lens+camera
collected 1.36 times more total light, and the same stars are 5.4 times
brighter, using 1/4 the exposure time. A four frame mosaic could be
done and get most of the field of view of the image in Figure 1a, and
collecting almost 4 times additional light.
CEF = 2.45 minutes-cm2.
CEFA = 873 minutes-cm2-arc-seconds2 (18.9 arc-seconds/pixel).
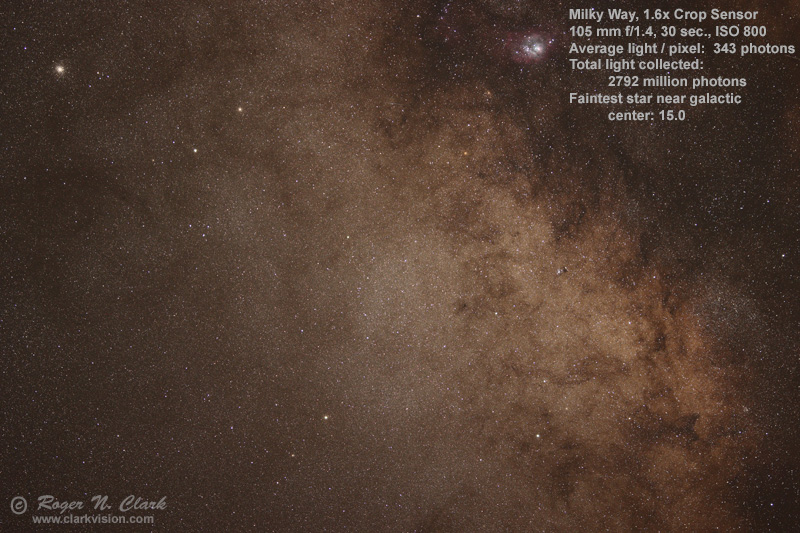
Figure 1c. The Milky Way imaged with a Canon 90D 1.6x-crop camera and
105 mm f/1.4 lens.
This longer focal length lens collected 1.4 times
more light than the 35 mm image in Figure 1b, despite the same f-ratio
and exposure time. Stars in the field are 9 times brighter than the same stars in Figure 1b.
CEF = 22.1 minutes-cm2.
CEFA = 873 minutes-cm2-arc-seconds2 (6.3 arc-seconds/pixel).
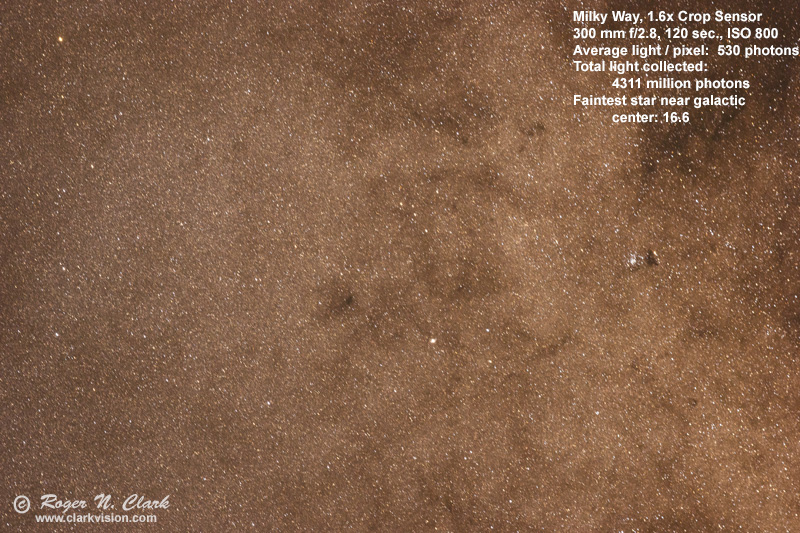
Figure 1d. The Milky Way imaged with a Canon 90D 1.6x-crop camera
and 300 mm f/2.8 lens.
This longer focal length lens collected
2.9 times more light than the 15 mm image in Figure 1a, despite
the same f-ratio and exposure time. Stars in the field are 400
times brighter than the same stars in Figure 1a.
CEF = 180 minutes-cm2.
CEFA = 873 minutes-cm2-arc-seconds2 (2.2
arc-seconds/pixel).
It should be obvious that the overall brightness of the images in
Figure 1a to 1d increases in brightness, with 1a being the least bright,
and 1d being the brightest. The full image histograms in Figure 2 show
this too. The trees in silhouette in Figure 1a account for less than 3%
of the image area, so is a tiny effect on total light collected.
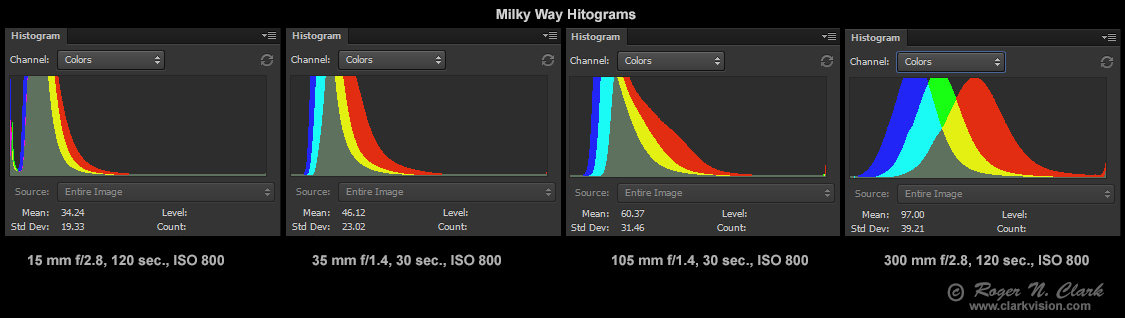
Figure 2. Histograms for the four images in figures 1a - 1d.
The further to the left of the histogram peaks and distribution,
the greater the light collected. Note too the histogram on the
right edge for each image. The spike at the right edge shows
saturated pixels, and that spike increases from the 15mm image to
the 300 mm image, indicating so much light was collected that
more stars saturated with the longer focal lengths (with
greater aperture diameters). Thus, the photons collected, shown
in Figures 1a-1d, is actually an underestimate
which gets worse with the larger apertures.
The Moon Example
Images of the Moon with various lenses and 2 sensor sizes are shown in Figures
3a through 3e. We see the average light per pixel increase
146 times from Figures 3a to 3d despite exposure time, f-ratio, ISO,
and sensor size held constant. So much for equation 1 and f-ratio controlling
light collection! Sensor size changed (2x linear, 4x area) between the images in
Figures 3d and 3e. Equation 1 predicts the light collected should decrease
by 4x. We also read on the internet that that a crop sensor camera is less
sensitive than a full frame camera, yet Figures 3d, and 3e show otherwise.
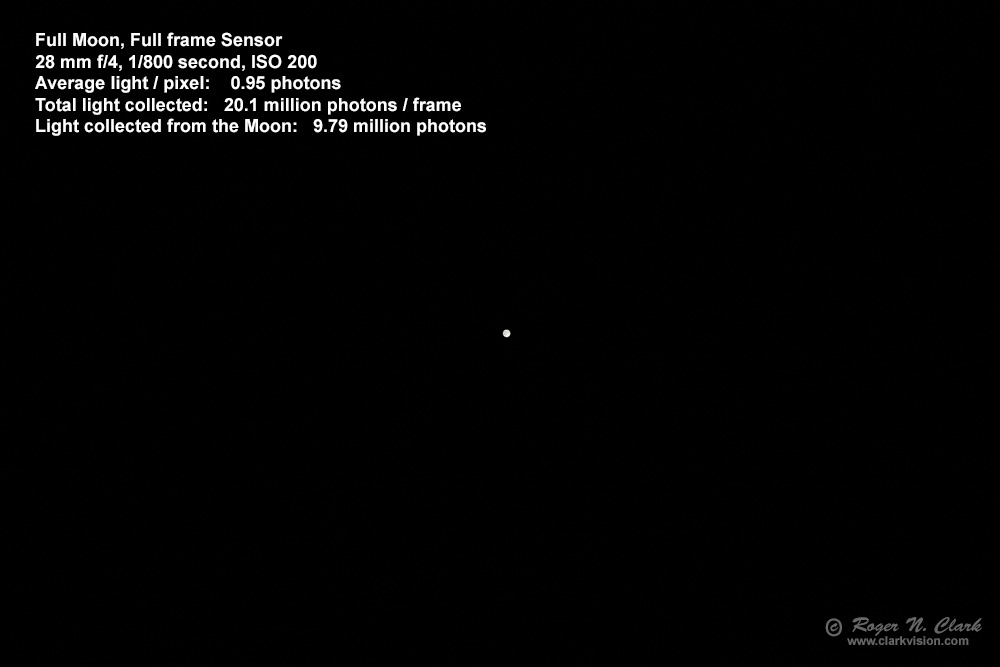
Figure 3a. The Moon. The entire frame is shown.
CEF = 0.0000080 minutes-cm2.
CEFA = 0.0178 minutes-cm2-arc-seconds2.
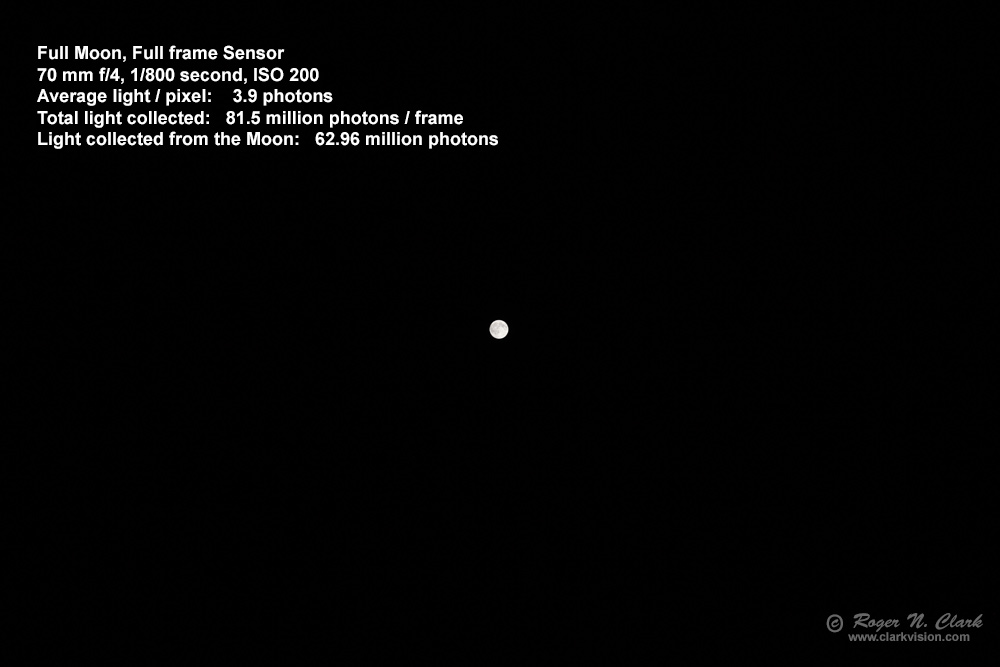
Figure 3b.. The Moon. The entire frame is shown.
CEF = 0.000050 minutes-cm2.
CEFA = 0.0178 minutes-cm2-arc-seconds2.
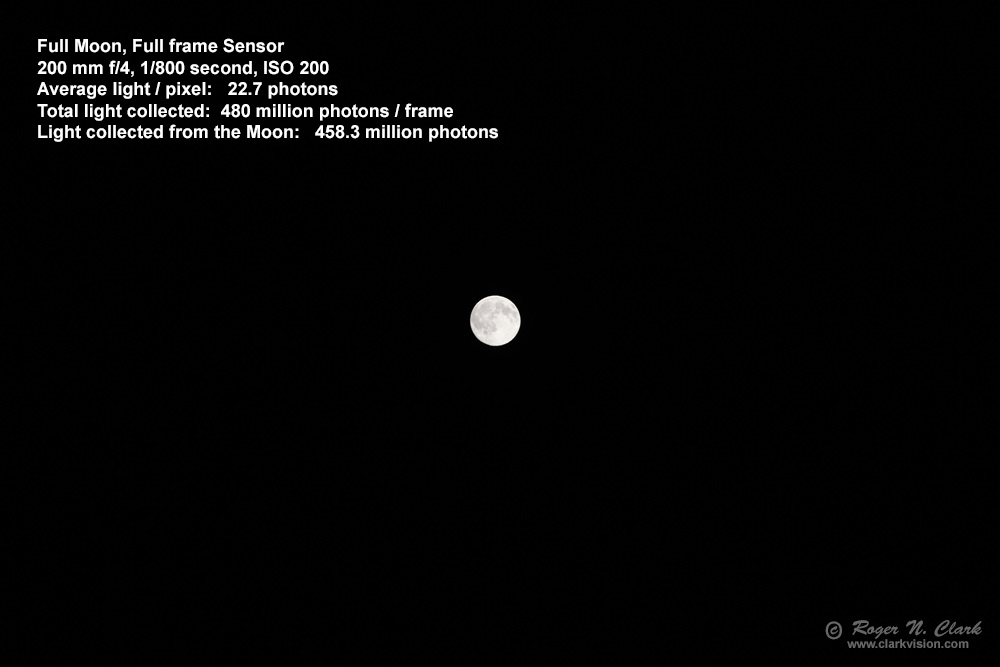
Figure 3c.. The Moon. The entire frame is shown.
CEF = 0.00041 minutes-cm2.
CEFA = 0.0178 minutes-cm2-arc-seconds2.
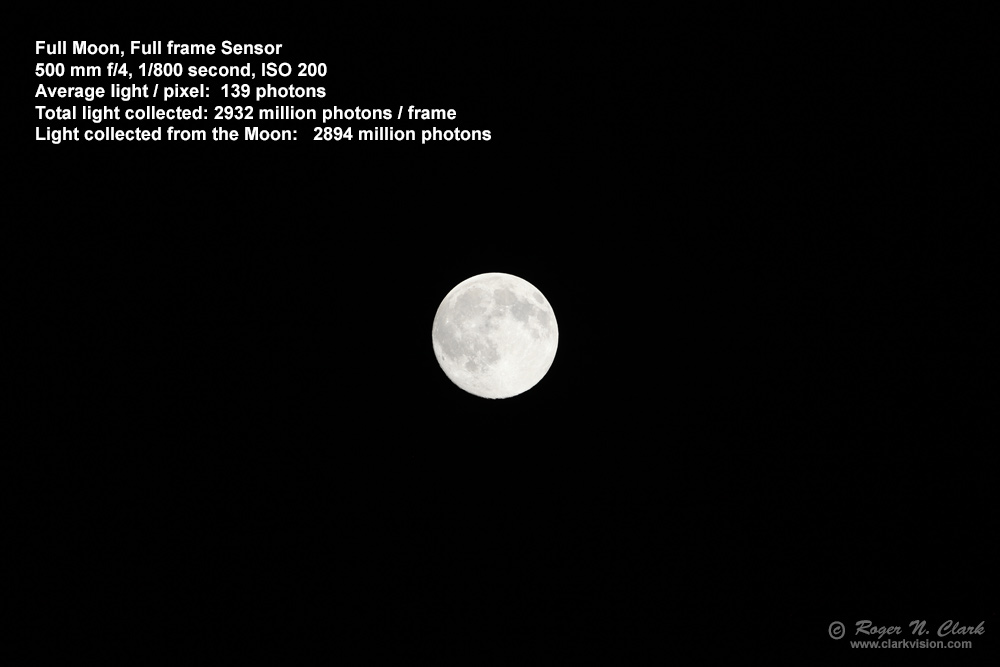
Figure 3d.. The Moon. The entire frame is shown.
CEF = 0.0025 minutes-cm2.
CEFA = 0.0178 minutes-cm2-arc-seconds2.
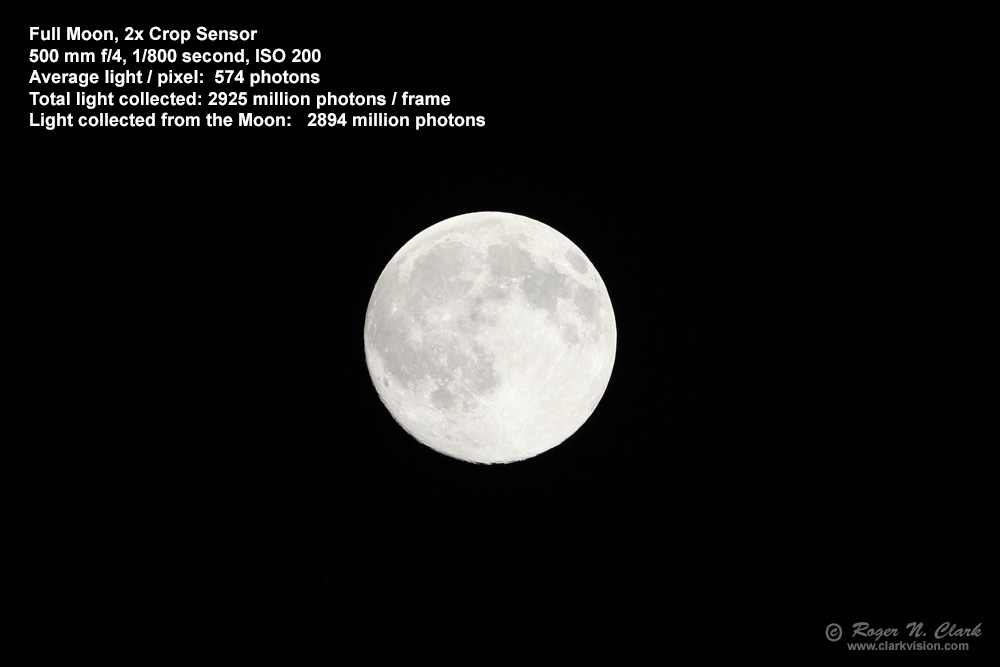
Figure 3e.. The Moon. The entire frame is shown.
CEF = 0.0025 minutes-cm2.
CEFA = 0.0178 minutes-cm2-arc-seconds2.
Indeed, we have seen this before: smaller sensors with smaller pixels are not less sensitive,
and can actually record fainter stars. See images 4a and 4b, which are Figures 9a and 9b
from earlier in this series:
1c) Characteristics of Best Digital Cameras and Lenses for Nightscape and Astro Photography.
Here we see that the APS-C camera recorded stars about 0.6 magnitude
fainter than the full frame camera. See the above article for more
information and the specific reason why.
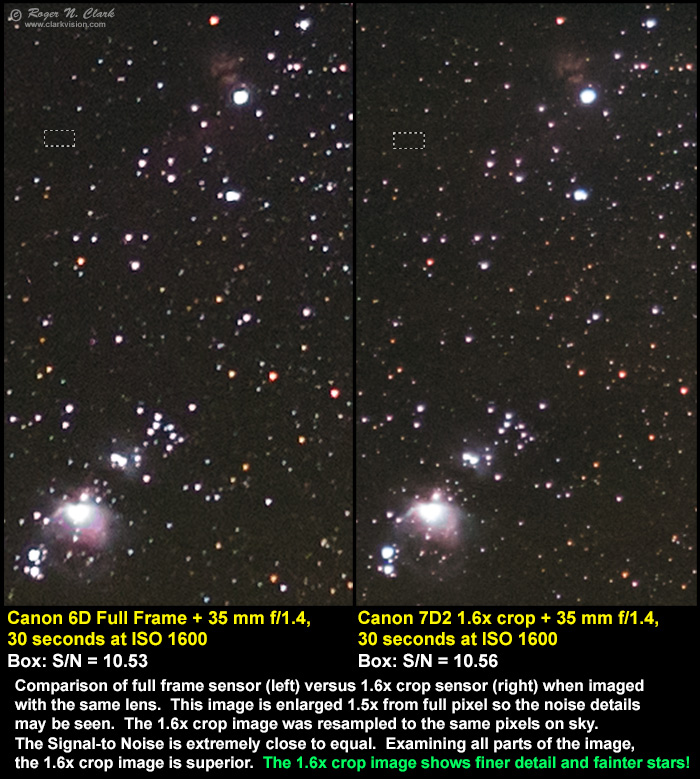
Figure 4a. Comparison of images made with a full frame and 1.6x crop
cameras. The ratio of the pixel areas is 2.59. Focusing on the subject,
not the pixel (after all what is the subject in a photo: an object in the scene,
or the pixel?), I binned the smaller pixels of the 1.6x crop camera
to the same pixels on subject in the full frame. By resampling to the
same pixel on the subject, we see that the signal-to-noise ratio (S/N)
is essentially the same in the uniform areas (agreement to better than
1 percent), but the smaller pixels of the crop camera actually record
fainter stars and more detail, even after resampling.
Compare the unbinned images in Figure 4b.
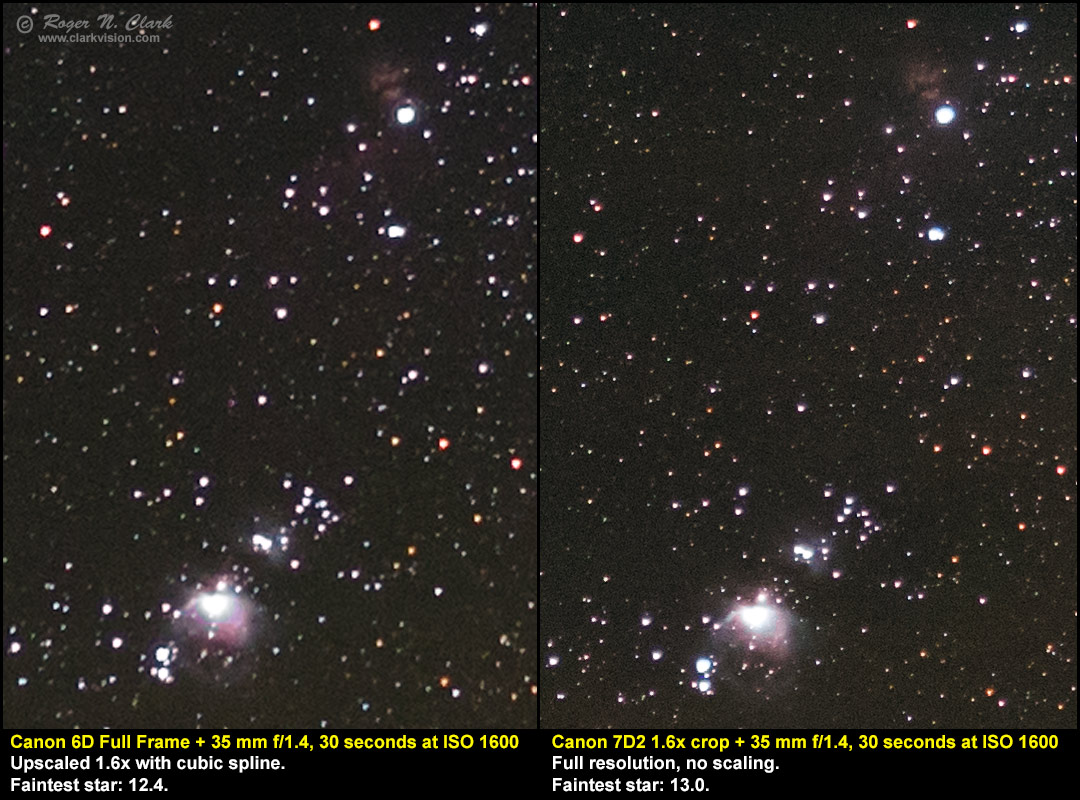
Figure 4b. Comparison of images from two cameras--the same as in Figure
4a, but the crop sensor image is shown at full resolution, and the full
frame camera enlarged 1.6x for comparison. The smaller pixels on the crop
camera record fainter stars, over 70% fainter (0.6 magnitude). The noise per pixel is
higher in the crop sensor camera, but there are more pixels, so the noise
appears smaller. There is also more fine detail in the crop sensor camera
image, thus providing better overall image quality despite technically
having more noise per pixel. And as shown in Figure 4a, when the pixel
angular areas are normalized, the noise is basically the same.
Light Collection from a Cheetah on the Serengeti
Distance and the Inverse Square Law.
A cheetah on the Serengeti is shown in Figures 5a and 5b. The cheetah in Figure 5b
is about 1.55 times closer, and while perspective changes some,
we would expect the number of pixels to increase by 1.552
= 2.40 and the amount of light to increase by change in distance squared
(the inverse square law), thus again a factor of 2.40. By analyzing the
images, I determined that the number pixels on the cheetah increased by
2,774,480 pixels / 1,123,000 pixels = 2.47 (very close to that expected
and different by only 3%, probably from the changing perspective).
The light collected from the cheetah increased by 7499 million photons /
3279 million photons = 2.3x, agreeing to better than 5% of prediction
(and the difference can be explained by the different perspectives).
Both these values are consistent with the inverse square law which says
the amount of light from an object will increase with the inverse of
the square of the distance to the object.
In the section on the Equations for Light Collection, equations will be shown
for terrestrial objects illuminated by the Sun. We will again see that f-ratio
and sensor size are not variables in the fundamental equations.
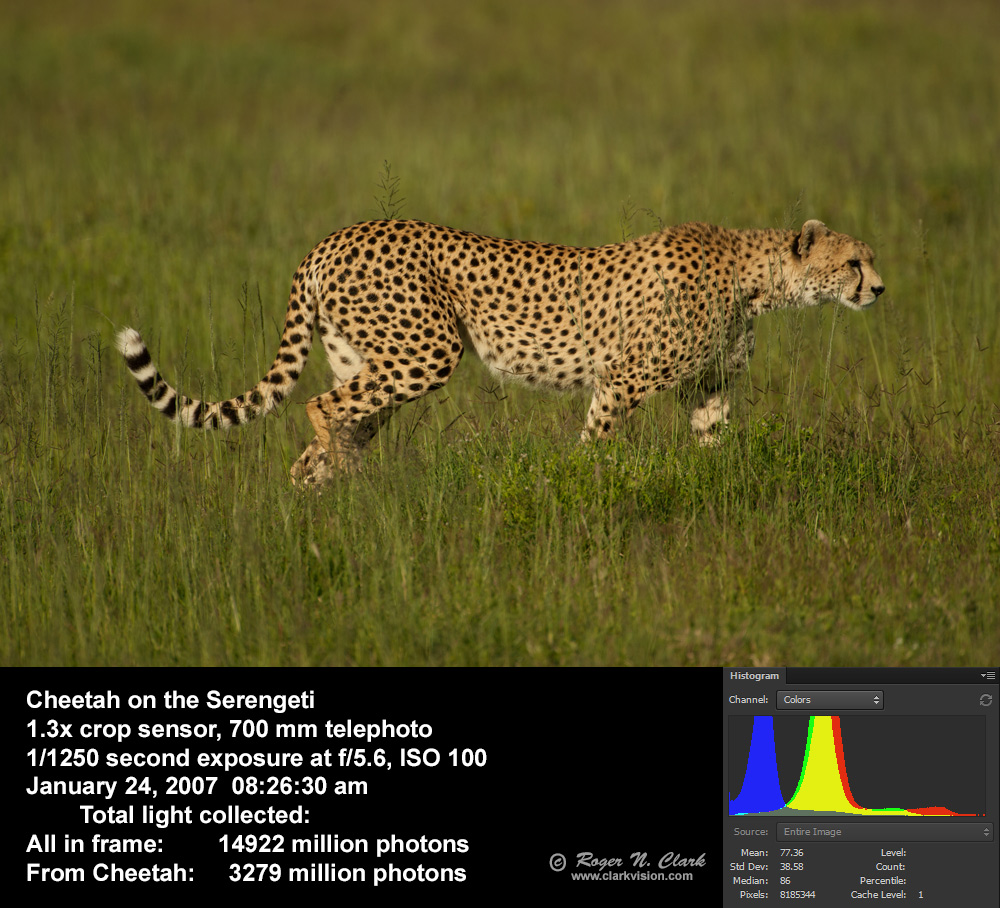
Figure 5a. A cheetah on the Serengeti The entire frame is shown.
The Cheetah takes up 1,123,000 pixels in the 8.4 megapixel frame.
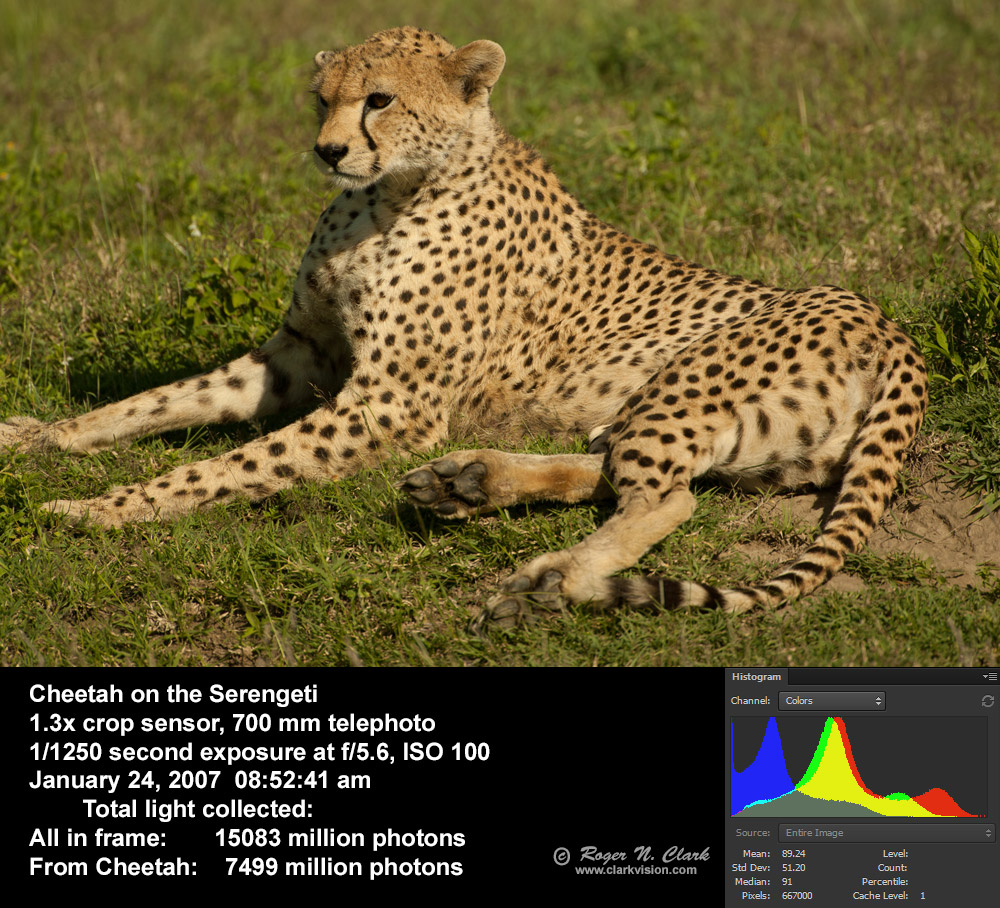
Figure 5b. A cheetah on the Serengeti The entire frame is shown.
The Cheetah takes up 2,774,480 pixels in the 8.4 megapixel frame,
and is 1.5 times closer.
Regarding the inverse square law, you can find on the internet some
"experts" saying it only applies to point sources. The inverse square
law always applies, and the cheetah example here shows that it applies
to non-point sources too.
Photon Rain Analogy
Any object that shines and/or reflects
light toward you and/or your camera sends a given number of photons per square centimeter
to the entrance pupil of your eye, camera lens, or telescope. Basic math says that a larger
entrance pupil area, the more light you collect. This light collection is independent
of the pixel size and focal length (Figure 6a). The rain and funnel analogy, while similar
to a lens and a pixel is limited because the water funnel can't direct water to different buckets
depending on the angle the rain is hitting the funnel, like a lens can (Figure 6b),
but the analogy still holds.
Figure 6a. Raindrops (blue) as an analogy to photons entering a
camera. The buckets ("pixels") fill with water (blue), but the orange
funnels (the lens) collect the rain and focus it onto the buckets
(pixels). In this case the large end of the funnels have the same diameter
so collect the same amount of rain per unit time (the exposure). The ONLY
difference is the small bucket will fill up faster, but that is not a
problem in low light situations. Small buckets are NOT a disadvantage. The
funnel diameter controls how much rain goes into the bucket, not the size
of the bucket. It is the same with cameras, lenses, and pixels. The angle
"a" is the is the angular size of a pixel and is the same for both the
large and small pixel in this example. In a camera, both cameras would
get the same amount of light per pixel, show the same noise, have the
same pixels on the subject, and have the same depth of field.
Figure 6b. Analogy of a funnel that directed rain coming in at different angles
to different buckets. This is what a lens or telescope does with light.
But, regardless of direction, the collection area and how much is collected
is dependent on the aperture area and the collection time for a given incoming rate.
Correct Model of Light Collection
As I mentioned above, we read all kinds of ideas about light collection
and camera sensitivity on the internet. For example, we commonly see
the idea that full frame sensors are about a stop (factor of 2) better
in sensitivity, but the images in Figures 4a and 4b, as well as 3d and 3e
prove otherwise. So where does that idea come from? Simple: the use of
larger physical aperture diameters on the larger sensor cameras. For
example, use a 50 mm f/4 lens on an APS-C 1.6x crop camera then upgrade
to a full frame camera and for the same field of view, change to an 80
mm f/4 lens. But what changed? The internet photographer thinks that
the only thing that changed was the lens focal length and sensor size,
and erroneously concludes the sensor is responsible. But what really is
responsible is more square centimeters of light collection by the lens.
The 50 mm f/4 lens has an aperture diameter (technically the entrance
pupil) of 50 / 4 = 12.5 mm and an area of 1.227 square cm. The 80 mm f/4
lens has an aperture diameter (technically the entrance pupil) of 80 /
4 = 20 mm and an area of 3.142 square cm. The 80mm lens has 3.142 /
1.227 = 2.56 times more area. The increase in lens aperture area is what
gives the cameras with the larger sensor more sensitivity: the causation
is lens aperture (entrance pupil) area, not simply sensor size.
To make quality images, the camera needs to collect enough light.
The noise we see in our digital camera images is mainly from the
light signal itself: the noise is the square root of the amount of
light collected. The noise we perceive is the signal-to-noise ratio,
SNR or S/N, the light signal divided by the noise:
S/N = light collected / square root (light collected)
= square root (light collected) (equation 2)
= apparent noise.
For light incident at the camera lens/telescope (or your eye), from an object,
like a star, the Moon, or a bird in a tree, the light collected
by the lens is
light collected = light incident per sq cm * aperture area (sq cm) * t * T (equation 3).
where t is the collection time (camera exposure time), and T is the lens
transmission factor. Typical camera lenses have transmission of around
70%, so T ~ 0.7 is a good assumption if the exact value is not known.
Why isn't f-stop in the equation? F-stop is a ratio, so adds confusion
regarding light collection. The f-stop (f-ratio) describes light density
in the focal plane, not total light collected. The varying apertures
in Figure 7 illustrates the problem. Note how the physical aperture
diameters vary a lot at the same f-ratio, and some "slower" f-ratios
(e.g. f/2.8) have physically larger aperture diameters than some f/1.4
lenses. If 1000 photons / square centimeter per second were incident at
the camera lens from an object (e.g. a bird in a tree), basic math and
logic says that the larger the aperture diameter, the greater the area
to collect light, so the more photons would be collected (equation 2).
Some photographers may claim that the shorter focal length lens collects
more light from its larger field of view, or that a larger sensor collects
more light by including more of a scene that misses the smaller sensor.
While there is different light hitting the sensor because you changed the
field of view, that additional light does not help improve the apparent
noise on objects in the scene, like a bird in a tree, or the Moon in
Figures 3a-3e, or the nebulae and stars seen in Figures 4a, 4b.
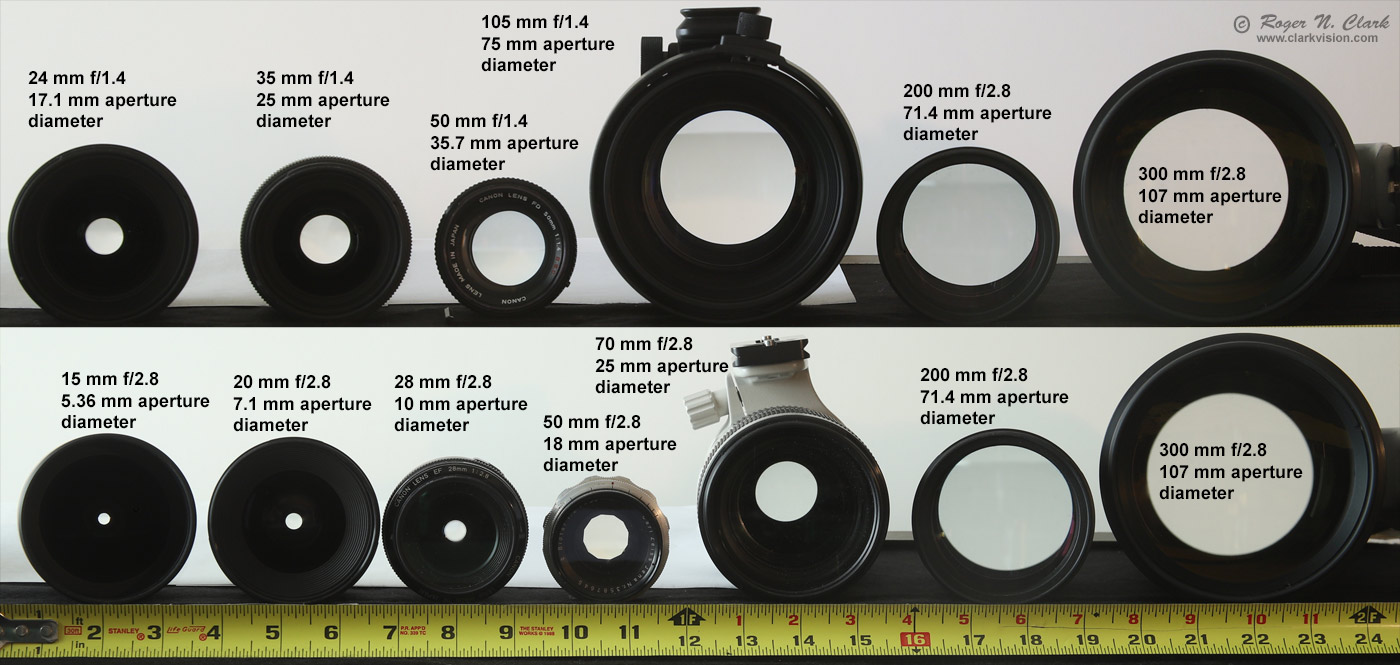
Figure 7. Aperture diameters are illustrated for lens with 2 different f-ratios.
Aperture area collects the light, not simply f-ratio.
All these examples illustrate the errors in interpretations of light
collected and the causes. Notice the CEF and CEFA numbers in Figure 1.
The CEFA is constant for each image, but the CEF increases from Figure
1a to 1d. Same with Figures 3a to 3d. And on both examples, we see an
increase in light collected from a to d. CEFA describes average light
density while CEF applies to total light from an object. But here
is the key to the problem: when comparing or selecting lenses/cameras
or both for the best light collection, the OBJECT must be kept the
same. All too often we see on the internet someone literally
changing the subject, thus causing confusion and concluding the wrong
thing is responsible to improved light collection and sensitivity.
An example of changing the object is imaging a uniformly lit blank wall.
Image the wall from the same position with a 50 mm f/4 lens on an APS-C
camera and an 80 mm f/4 lens on an APS-C camera and one observes the same
amount of light was collected in the same exposure time. Change to a
50 mm f/2 lens and with the same exposure time one records more light.
What is changing? The internet photographer says the only thing that
changed was f-ratio so f-ratio is the key. But two things were changing:
aperture area AND field of view, thus different part of the wall.
Between the 50 and 80 mm lenses, the field of view decreased in area by
2.56x and the lens aperture area increased by 2.56x, thus resulting in
two factors cancelling each other resulting in the same amount of light
collected. By changing the field of view the object size has changed.
The key parameters changing in this example are object size (the area
of the wall imaged) and the lens collecting area. By not tracking these
two key variables, a wrong conclusion is derived when concluding f-ratio
is the key variable. If you change distance to the wall, then the area
imaged on the wall changes, so again, the object changes. Failure to
track the key variables in an experiment is what leads to errors in what
controls light collection.
All to often we see people making claims about camera sensor sensitivity,
or collecting light that is not relevant to the problem by changing
multiple parameters and attributing the result to one or a totally
different parameter. A classic example, is sensor size: put a 50 mm
f/4 lens on APS-C 1.6x crop camera versus 80 mm f/4 lens on a full frame
camera, and attribute the improved light collection to the sensor size.
The correct parameter is the lens aperture area:
50 mm f/4 = 1.25 cm aperture diameter = 1.227 sq cm aperture area.
80 mm f/4 = 2.00 cm aperture diameter = 3.142 sq cm aperture area.
The aperture area ratio is 3.142 / 1.227 = 2.56 so the 80 mm lens collected
2.56 times more light. The sensor area ratio is 1.62 = 2.56.
The larger sensor just collects light from the larger physical image area,
but the lens aperture area is the reason for the greater light collection, not
the sensor size. Causation versus correlation. Sensor size correlates with
the increased light collection for this particular use case but is not
the cause. Note too that the systems are not equivalent: the 80 mm f/4 lens
on the full frame camera has a shallower depth of field than the 50 mm f/4 lens
on the crop camera. To make the depth of field the same (and assume the sensors
have the same number of megapixels), the 80 mm lens would need to be
stopped to the same physical aperture, 1.25 cm (12.5 mm, of 80/12.5
= f/6.4). The the light collection would then be the same for the same
exposure time, the depth of field would be the same, and the apparent
noise would be the same. See
2) Understanding Exposure
for more information (and see Figure 1c in that article).
The lens focal length spreads out the light onto the focal plane.
The total light from the Moon or the bird in the tree is the same
regardless of the focal length. For example, double the focal length
without changing the aperture diameter and the image of the Moon or bird
becomes twice as large. The light is spread over a larger area so the
light per square mm (or whatever area unit you want to use) is less, but
the object covers more square mm. Sum all the pixels and we will find
the total light from the object is the same regardless of focal length.
This changing amount of light per square mm is light density, and forms the
basis for exposure, the relative fill of photoelectrons in a digital
camera pixel. Because camera photographic exposure is a relative
measure dependent on settings, and the area of a pixel varies between
cameras, this light density concept, which came from a simplified
concept in film photography, has lead to massive confusion and arguments
in photo forums on the internet. The f-ratio describes relative light
density for a uniformly lit subject. Light density, f-ratio, ISO,
pixel size, sensor size and actual light collection are some of the most
misunderstood imaging relationships on the internet as of this writing.
When we analyze specific situations like the examples given above, in
every case the total light from an object at a given distance in the field of view comes
down to just lens aperture area, lens transmission, exposure time, and
sensor efficiency. I'll give the equations and how to calibrate your
sensor in the appendix below (and why an astrophotographer might want to do that), and give use
cases in the next section. If you read anywhere on the web, or in a book,
claim of light collection or sensitivity, closely examine what parameters
were changed to see if they inadvertently attributed light collection or
sensitivity to a specific thing when another parameter is responsible.
Key things to look for is changing lens aperture diameter (thus area),
distance to the subject, or changing the field of view so different
objects are in the scene. Note, we even see such changes being done on
high profile review sites!
Equations for Light Collection
The light collected from an object covering angular area Omega, Ω, e.g. the Moon, a star,
a bird in a tree, a person's face, or any other object is
Light Collected = EtST ∝ A * Ω(object) * T * SE
(equation 4)
where
EtST = Etendue (Et) times System efficiency (S) times exposure Time (T),
Etendue = A * Ω, also called the A Omega product,
A = lens aperture area (more precisely, the lens entrance pupil area),
A = pi * D2 /4. where D = Lens diameter (entrance pupil diameter),
D = aperture diameter = focal length / f-ratio,
pi = 3.14159,
Ω (Omega) is the solid angle of the object,
T is the exposure time, and
SE= system efficiency = optics transmission * fill factor * quantum efficiency.
Note, the ∝ means proportional to.
The quantity A * Ω is called the Etendue and is described in more detail here:
Understanding Exposure.
Again, note that there is no f-ratio in the above equations.
Light collection from an object, at the fundamental level, is simply
Etendue * Exposure Time * System Efficiency.
Modern cameras and lenses have similar system efficiencies. Lenses have
about 70% transmission or perhaps a little better. Modern digital cameras
have around 50 to 70% quantum efficiency (the fraction of photons that
actually result in photoelectrons) (older cameras may have quantum
efficiency in the 25-35% range). Thus system efficiencies for newer
cameras are on the order of 0.7 * 0.5 ~ 0.35 or 35%.
Equation 4 tells us the relative proportion of light received, but how about
calibrated levels given a known brightness? In astronomy. object brightness
is given in stellar magnitudes, which is a log scale based on the 5th root of 100
(1001/5 = 2.51189). For an object (star, galaxy, spot in a nebula,
the Moon, bird in a tree) of a given stellar magnitude, M, the light collected, P,
is
P = Ka * 2.51189(4.0-M) * A * Ω * T * SE, (equation 5a)
In the Appendix: Calibrate Your Camera section below, I show how to derive the constant K
where the value of Ka = 35927 was found for the green channel, so the general equation for light collection
given the brightness of the object in the green channel is:
PG = 35927 * 2.51189(4.0-M) * A * Ω * T * SE, (equation 5b)
where
35927 = derived constant, Ka, in photons per sq arc-sec per sq cm per second (green channel, magnitude 4)
PG = light recorded in photons, green channel
M = surface brightness in magnitude / square arc-second,
A = lens/telescope aperture area in square centimeters
Ω = the solid angle of the object in square arc-seconds,
T = exposure time in seconds, and
SE = system efficiency.
Result is in photons for the green channel.
For terrestrial applications for morning or afternoon sunlit scenes, the light
collected is:
P = Ke * R * A * Ω * T * SE, (equation 6a)
where
Ke is a constant for low Sun daytime terrestrial (Earth) applications, and
R is the reflectance of the object.
For the green channel, the light collection equation for daytime Earth photography is:
PG = 230900 * R * A * Ω * T * SE, (equation 6b)
The Ke = 230900 factor derives from the Moon
images. Because the low phase angle (e.g. near full Moon) lunar average
reflectance is about 0.15, 34628.4 (from Appendix) / 0.15 = 230856 and rounded
to 230900. Of course the constants Ka and e can
be refined with additional measurements. Also, now that we have a basic
equation to predict the light collected, we could make a measurement of
an object with known reflectance (e.g. a MacBeth color chart or 18% gray
card) with a new camera and lens and solve for the system efficiency, SE.
Then if the lens transmission were known, the sensor efficiency can
be derived.
How Does Equation 5b Agree with Astronomical Photography? The data
from Figure 3 and equation 5b are shown in Table 1a, below. Note all
images were made with the same camera and we'll assume all lenses have
the same transmission of 0.7 for an SE= 0.25 (the Canon 5D Mark II
used for the Moon images has a quantum efficiency about 35%, so 0.35
* 0.7 = 0.245, round to 0.25). The camera settings were the same
(1/800 second, f/4 ISO 200). The Average surface brightness of the
Moon was 4.04 magnitudes per square arc-second. The size of the Moon
is fixed, about 1/2 degree (1800 arc-seconds), so Omega is about (pi /
4) * 18002 = 2544690 square arc-seconds, close to the exact
values in Table 1a for the date the Moon images were made.
The predicted light collection closely agrees with the observations.
                                      Table 1a
                           Light Collection from the Full Moon

Lens    Crop    M      A        Omega        T       SE     P eqn 5b   Measured green pixels   Disagreement
       Factor       sq. cm   sq. arc-sec    sec              Photons   Photons (millions)    (G1+G2)*2 observed
                                                           (millions)   G*4     (G1+G2)*2      / Predicted
 28 mm   1.0  4.04    0.385   2863548     0.00125   0.25      11.93    12.78       12.86        1.062
 70 mm   1.0  4.04    2.405   2863548     0.00125   0.25      74.52    82.58       82.41        1.106
200 mm   1.0  4.04   19.635   2863548     0.00125   0.25     608.42   599.7       600.1         0.986
500 mm   1.0  4.04  122.718   2863548     0.00125   0.25    3802.6   3802.2      3803.1         1.000
500 mm   2.0  4.04  122.718   2863548     0.00125   0.25    3802.6   3802.2      3803.1         1.000
Notes: the disagreements are most likely due to the actual lens transmission versus the assumed value.
How Does Equation 6b Agree with Terrestrial Photography?
The cheetah in Figures 5a, and 5b was photographed with a Canon 1D Mark
II with a pixel pitch of 8.2 microns (0.0082 mm). The
plate scale
at 700 mm is
206265 *0.0082 mm /700 mm = 2.416 arc-seconds, so the angular area of one pixel
is 2.412 = 5.837 square arc-seconds. From that value and the number of pixels
covered by the cheetah, we get the value of Omega for each observation.
For example, from Figure 5a, we see the cheetah covered 1,123,000 pixels,
thus Omega = 5.837 * 1122652 = 6552920 square arc-seconds.
Assuming the Cheetah reflectance in the visible is 0.25, equation 6b was
used to compute the predicted photons, P, in Table 1b, using SE = 0.10
The prediction is good, but a little low. Maybe the reflectance or the
SE was a little low.
                                      Table 1b
                      Light Collection from a Cheetah on the Serengeti

Lens    Crop  Reflectance   A    Relative    Omega      T      SE    P eqn 6b  Measured green pixels   Disagreement
       Factor     R      sq. cm  Distance sq. arc-sec  sec            Photons   Photons (millions)  (G1+G2)*2 observed
                                                                    (millions)   G*4     (G1+G2)*2     / Predicted
500 mm   1.0    0.15     122.718    -      2863548   0.00125  0.25    3803.5    3802.2    3803.1        1.000
700 mm   1.3    0.25     122.718   1.0     6552920   0.00080  0.10    3713.6    4145       4149         1.117
700 mm   1.3    0.25     122.718   1.55   16194546   0.00080  0.10    9177.6    9475       9478         1.033
Notes: the disagreements are most likely due to the actual reflectance of the cheetah versus the assumed value
and changing reflectance with phase angle. Regardless, considering the approximations, the agreement is good.
Predicting Light Collection: by Applying the Equations
Let's say you want to detect a spiral arm in a galaxy. For simplicity,
say we want to detect a portion of the arm that is one square arc-minute
in size, and that the arm has a surface brightness of 22 magnitudes /
square arc-second. The solid angle, Ω, to be considered is 60
arc-seconds *60 arc-seconds = 3600 square arc-seconds. Further, let's
consider a more modern camera the system efficiency, SE = 0.5. Next,
we image in a good night sky with a sky brightness of 21 magnitudes per
square arc-second. What signal-to-noise ratio, S/N, can we achieve?
Table 2 shows some possibilities. We see from the results, that all
the proposed lenses and short exposure time of only 100 seconds do a
good job. As S/N improves, one can detect smaller details within that
patch of the spiral arm.
                                      Table 2

            Lens    f-       M     M      A       Omega      T     SE       P           P
Object             ratio  galaxy  Sky  sq. cm  sq. arc-sec  sec           Photons    Photons   S/N
                                                                        galaxy arm    Sky

galaxy arm  200 mm  2.8    22.0  21.0   40.04     3600      100    0.5     16337     41037      68
galaxy arm  300 mm  4.0    22.0  21.0   44.19     3600      100    0.5     18030     45290      72
galaxy arm  300 mm  2.8    22.0  21.0   89.92     3600      100    0.5     36689     92159     102
galaxy arm  500 mm  4.0    22.0  21.0  122.72     3600      100    0.5     50072    125776     119
Notes: S/N is the photons from the object, the galaxy arm, divided by the
square root of the sky + arm signal. This ignores noise from dark current,
which is often comparable to the noise from a dark sky. If so, then
the S/N would be reduced by about root 2.
Light Collection: F-ratios vs Aperture
The photographers often confuse f-ratio with light collection.
From the above discussion and equations, it should be obvious that
aperture is the key to light collection, but here I show a demonstration.
Say you want to make a nice image of the North America Nebula in only
a single 30 second exposure, and for your camera, a 100 mm lens will
give enough detail. Which lens would you choose to make the image,
a 105 mm f/1.4 lens or a 300 mm f/4 lens?
Internet "wisdom" would say that the f/1.4 lens collects more light.
A 105 mm f/1.4 lens has an aperture diameter of 75 mm. A 300 mm f/4 lens
has an aperture diameter of 75 mm. The equations for light collection
would say that both lenses would collect the same amount of light from
the nebula in the same exposure time. The "internet" would say the
exposure with the f/1.4 lens would collect more light.
An image of NGC 7000, the North America Nebula, made with a 105 mm f/1.4
lens is shown in Figure 8a. and the image made with the 300 mm f/4 lens
is shown in Figure 8b. The raw data from both lenses (which used the
same camera) were converted to linear data (using Deep Sky Stacker) and
white balanced, then both stretched with rnc-color-stretch using the
same parameters (rootpower = 8, rootpower2 = 4, scurve1). The image
in figure 8b was resized to the size the image would be at 100mm.
Clearly the image in Figure 8b made with the f/4 lens is darker than
the image in Figure 8a made with the 105 mm f/1.4 lens.
But what about light collection?
The light in the 300 mm lens was spread out over more pixels compared to the
image made with the 105 mm lens (a factor of (300 / 105)2 = 8.16x).
If we bin by summing 3x3 pixels, the light per pixel would be 9 times more
and the pixels on the subject would be close to the same. That binning was done,
followed by the same stretch and the result shown in Figure 8c. Now we see that
the brightness of the f/4 image has been increased substantially, and in fact
is slightly brighter than the f/1.4 image (because the binning was 3x3, not
2.86 x 2.86 (one can't bin non integer pixels). In any case the brightness is very close,
as predicted by light collection is proportional to aperture area times exposure time,
not simply f-ratio.
This illustrates another property: by binning pixels 3x3, the 300 mm f/4 lens
effectively turned into an f/1.33 lens (100 mm focal length / 75 mm aperture)!
Thus, binning effectively decreases f-ratio!
Another interesting result is that the stars are much better in the binned
images (Figures 8b, 8c). So which lens made the better image of NGC 7000?
Clearly, the binned 300 mm f/4 lens, not simply the faster f-ratio.
The clear apertures were the same, and collected the same amount of light.
But binning reduces star size, effectively reducing any visible aberrations
in the lens.
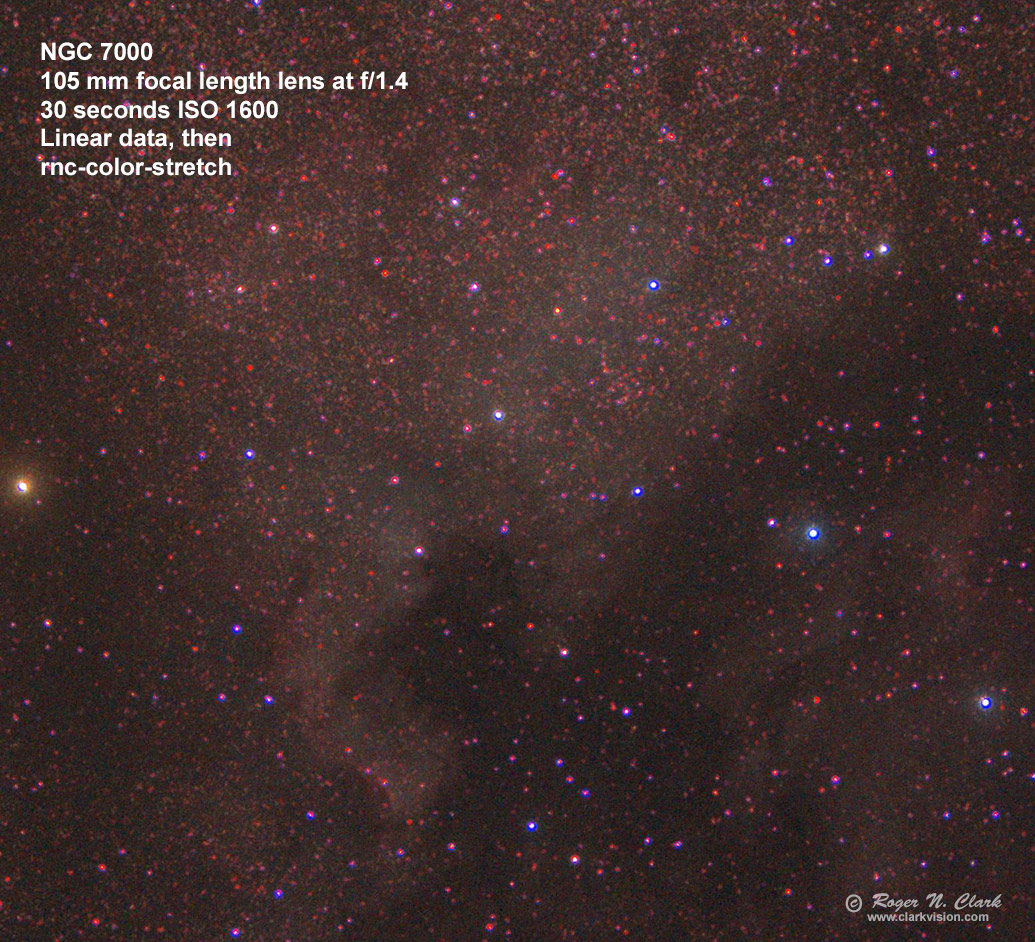
Figure 8a. Image of NGC 7000 made with a 105 mm f/1.4 lens with a single 30 second exposure.
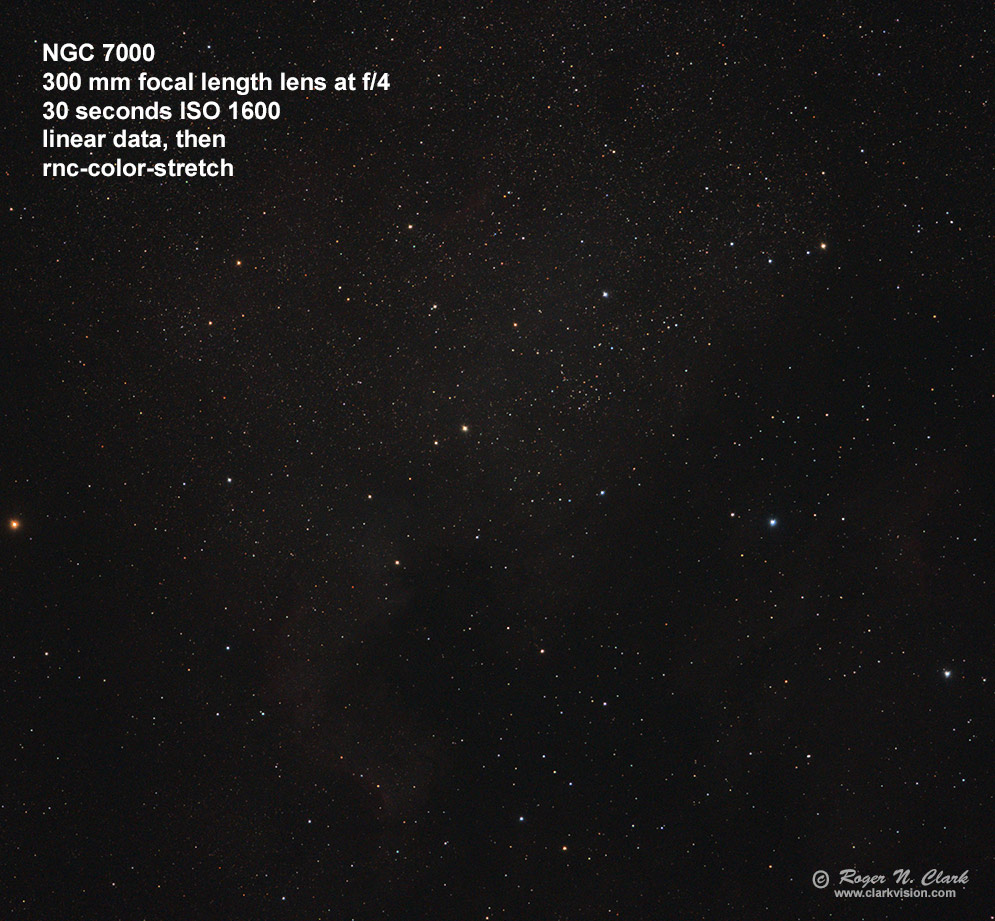
Figure 8b. Image of NGC 7000 made with a 300 mm f/4 lens with a single 30 second exposure.
The image was downsized by cubic spline for display. The image is clearly
darker than the f/1.4 image in Figure 8a.
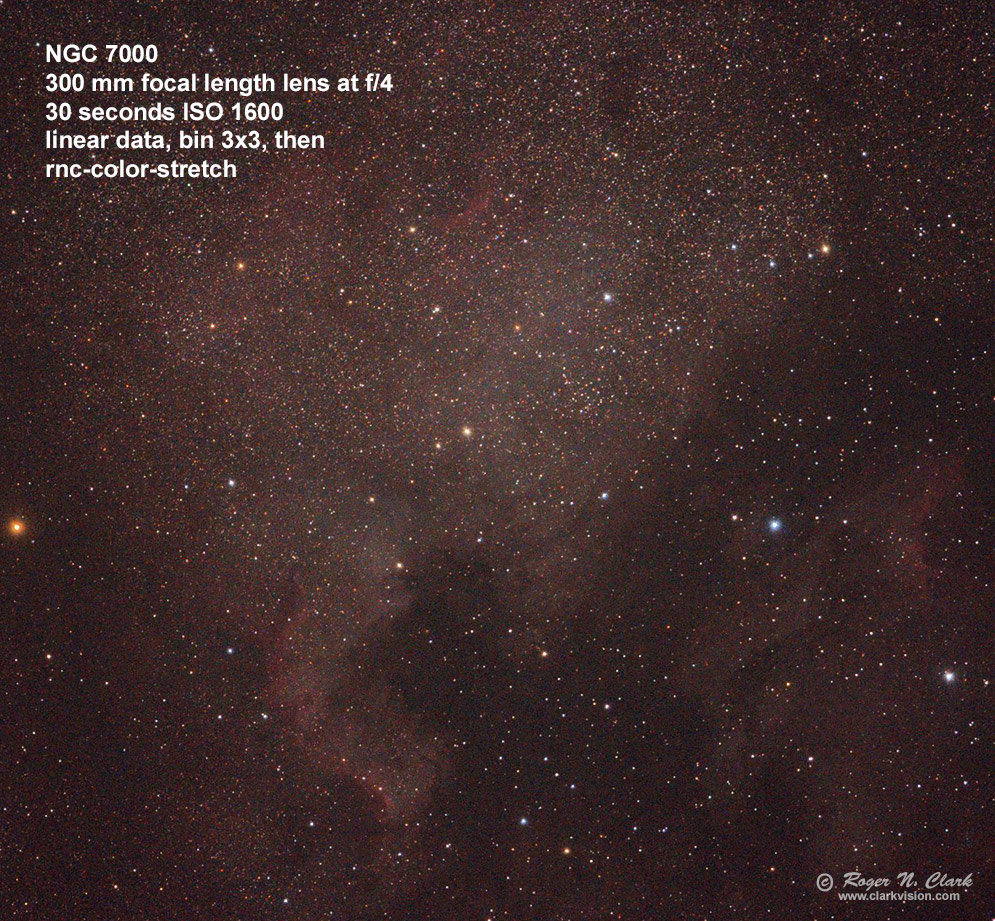
Figure 8c. Image of NGC 7000 made with a 300 mm f/4 lens with a single 30 second exposure
then binned by summing every 3x3 pixels. Now we see that the image brightness and
pixels on the subject are very close to the image in Figure 8a made with the f/1.4 lens.
But note that the stars are much smaller and lens aberrations imperceptible compared to the image
in Figure 8a.
Some people are obsessed with light per pixel and would choose
a faster f-ratio or camera with larger pixels to get more light
per pixel. Using the data from the 105 and 300 mm lenses, The
finer resolution of the 300 mm lens produces a better image at
full resolution than the 105 mm lens (Figure 8d) despite having
about 9x less light per pixel. The 105 mm f/1.4 image with a 75 mm
aperture shows stars to about magnitude 14. The 300 mm f/4 image
with a 75 mm aperture shows stars to about magnitude 15.5. This is
because the longer focal length for the same aperture spreads the
sky background out more, reducing noise from the sky background,
and in this case by about square root 9, or 3x. A 3x reduction in
noise means fainter stars by more than one magnitude can be detected.
Add to the fact that the f/4 lens produces better star images than
the f/1.4 lens, then the gain is about 1.5 magnitudes! For the same
aperture area, the longer focal length can produce better images,
than a shorter focal length faster f-ratio of the same aperture.
Similarly, smaller pixels can produce better images than larger
pixels even with less light per pixel, because one has
many more pixels on objects in the scene.
The longer focal length also shows fainter stars.
Note that there may be a perception issue in Figure 8d in that the
105 mm focal length image (left panel) may appear to show better
contrast than the 300 mm image (right panel). This is a false
impression. The shorter focal length does not fully resolve faint
stars that are more prevalent in the NGC 7000 nebula than in the dark
nebula region where there are fewer stars. The 300 mm image shows
the nebula better because it resolves the faint background stars.
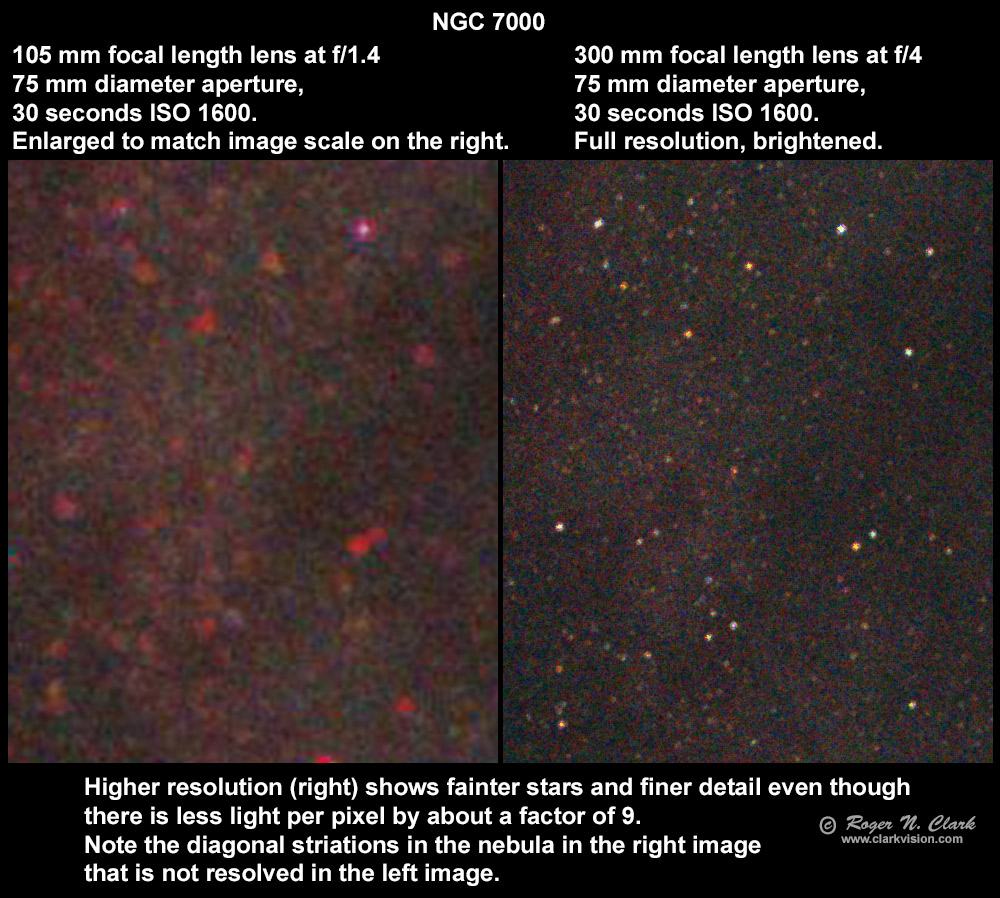
Figure 8d. The full resolution 300 mm f/4 image from Figure 8b
was brightened with curves (right image) to approximately match
the brightness of the 105 mm f/1.4 image from Figure 8a (left).
The section of the image is the "Mexico" region of the North
America nebula. Despite about 9x lower light per pixel, the f/4
image (right) shows fainter stars and finer detail, and the star
images are smaller in diameter. Note the striations in the nebula
(about 2 to 8 o'clock orientation) in the middle of the 300 mm f/4
image that are not resolved in the 105 mm f/1.4 image, despite the
f/1.4 image have about 9 times greater light per pixel, because
one has many more pixels on objects in the scene.
Online we see people complaining about adding Barlows/teleconverters
and "losing light per pixel." Figure 8e illustrates losing
light per pixel, and I made the problem "extra worse" by adding a
2x teleconverter (4x light loss per pixel) and decreasing pixel
size from 4.09 to 3.2 microns, for a reduction in pixel area of (4.09 /
3.2)2 = 1.63x, for a total light reduction per pixel of 1.63 *
4 = 6.5 times. There are several ways to compare images and Figure 8e
shows them all. Show the images at the same scale (A vs B or C
vs D). Or compare original resolution (A vs D). In A vs B or C
vs D the image made at 600 mm has smaller noise and finer detail.
In A vs D, A shows more noise but finer detail. The advantage of
the longer focal length, even though less light per pixel, one
can manage final image scale and trade noise for detail (also
illustrated above with the NGC 7000 example).
The longer focal length also shows fainter stars.
Another advantage of adding a teleconverter is that if one bins
the image to lower final pixel scale, not only are stars smaller
and finer detail shows, but dynamic range is increased. With a 2x
Barlow/teleconverter, dynamic range is increased 2x if one is sky
noise limited. If the sensor is read noise limited, dynamic range
is increased by square root 2, or 1.4x.
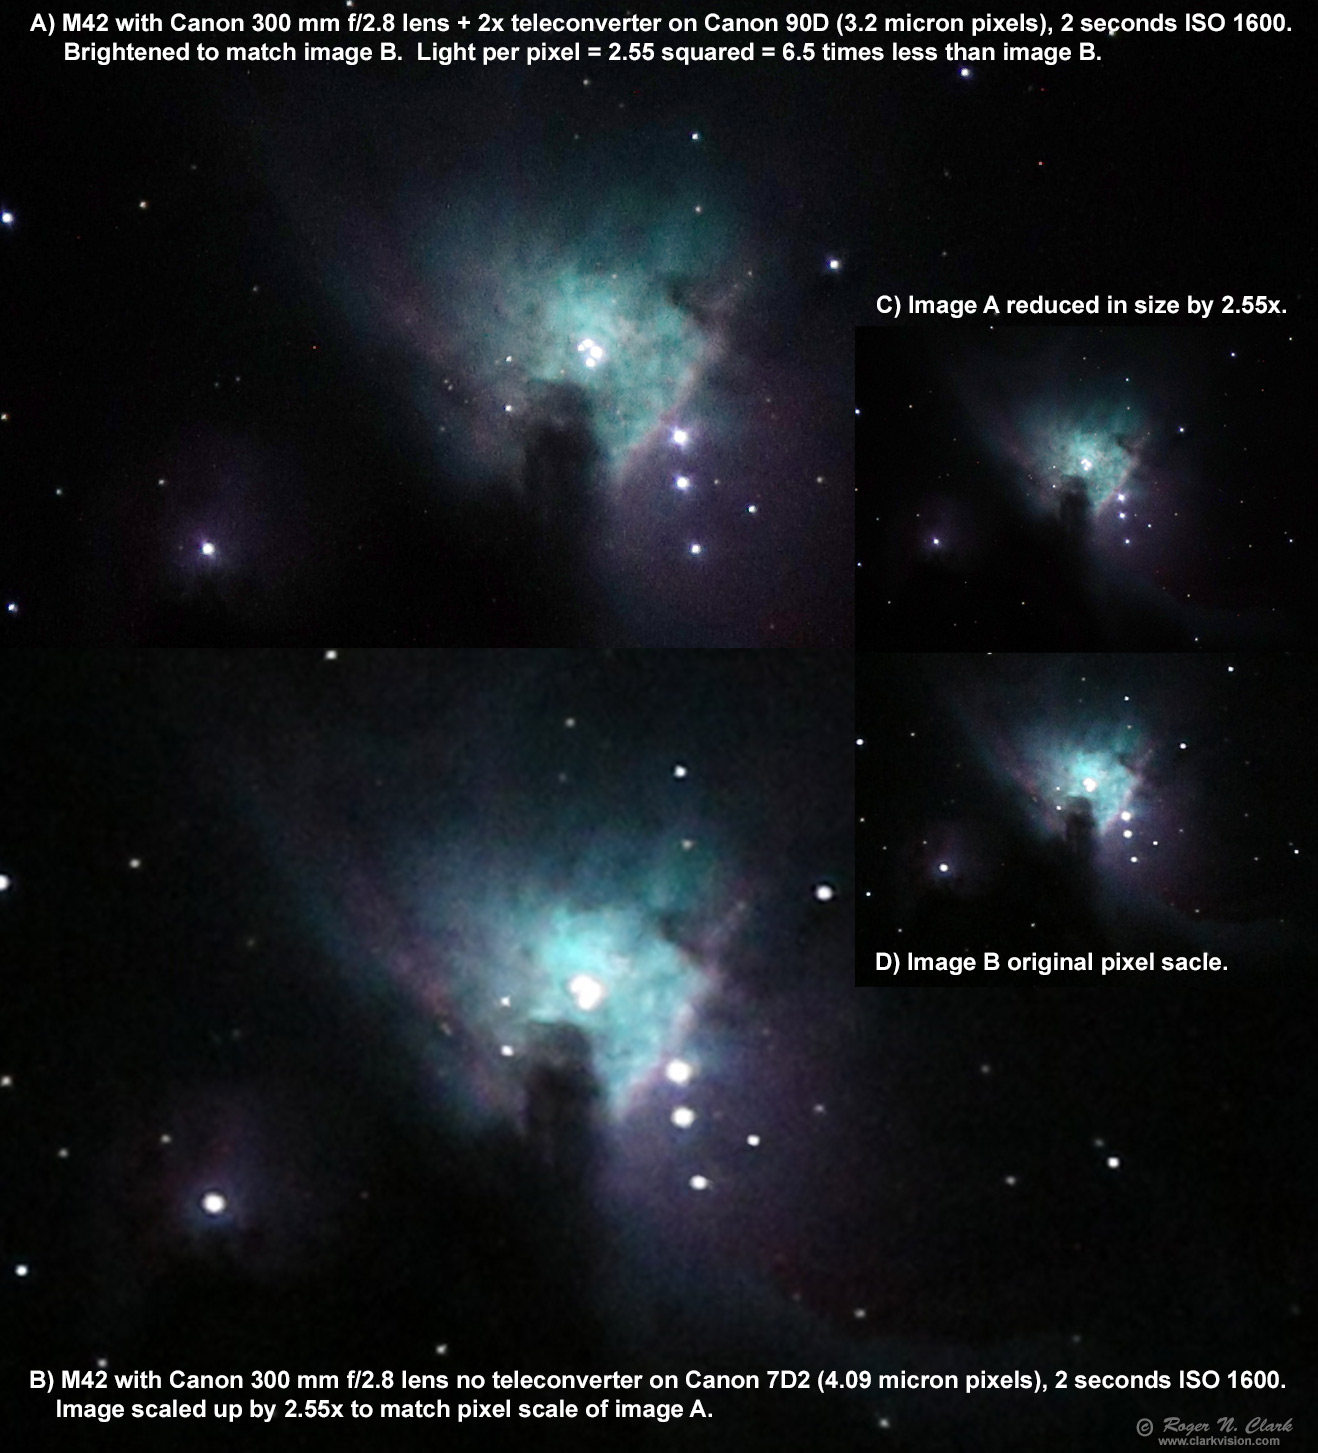
Figure 8e. The effects of adding a 2x Barlow/teleconverter are
shown. The same lens with a 2x converter (A, C) 600 mm f/5.6
vs no converter (B, D) are shown, 300 mm f/2.8. The images in B and D were
made at f/2.8 with a 107 mm aperture lens and 4.09 micron pixels.
The images in A and C were made at 600 mm, f/5.6 with smaller pixels,
3.2 microns in size. The light per pixel is 2.552 = 6.5
times less in image A and C, yet produces a finer detailed image,
and while noise is technically greater, its impact is less for the
same output pixel scale because the noise appears smaller in the
600 mm image.
The longer focal length also shows fainter stars.
Per Pixel Level Signal Detection Controversy
Some on the internet continue to push back on the the above and continue to
say that per pixel signal-to-noise ratio is the key factor, not aperture. The equation they use is:
Light Collection per pixel ∝ pixel_area/focal_ratio2
This equation does give proportionally the signal per pixel.
But this metric ignores the different number of pixels on an object
with systems with different focal lengths and thus how well an
object can be detected with different systems.
I posed the following thought exercise. Which telescope can detect
fainter objects, a little Redcat 51 (51 mm aperture, f/4.9) or
Hubble (2400 mm aperture, f/31), assuming Hubble was on Earth?
Redcat 51, f/4.9, 250 mm focal length, 51 mm aperture diameter,
with a camera having 4 micron pixels.
Redcat telescope: pixel_size2 / focal_ratio2 = 42 / 4.92 = 0.666 microns2
Hubble: 15 micron pixels, ~77300 mm focal length, 2400 mm aperture diameter, the WFC3 camera operates at f/31:
Hubble telescope: 152 / 312 = 0.234 microns2
Light per pixel Redcat / Hubble: 0.666 / 0.234 = 2.85, so the Redcat
gets 2.85 times more light per pixel (ignoring any space advantage) and assuming
same sensitivity sensors.
"Internet Expert" says: "I think the per-pixel SNR of the Redcat
will be greater than that of the Hubble and will see fainter
structures than the Hubble at the native pixel scale. Sure you
can bin the Hubble's pixels and improve the resulting SNR at the
expense of resolution. ... Note that pixel binning is the method
you implicitly use in most of your examples."
Actually no. Pixel binning is not needed. Again it comes down to
area on the sky that each systems pixels see and the number of pixels that
cover the object.
Figure 9a shows a calculated scene with a single pixel having an
signal-to-noise ratio of 1.0. The top image shows the background
noise (this could be from sky signal, dark current, and/or read
noise--it doesn't matter. With a single pixel, one can't be sure of
any detection. Note we are comparing a Redcat 51 with a camera with
4-micron pixels, where each pixel measures 3.3 x 3.3 arc-seconds
of sky. Hubble sees 0.04 x 0.04 arc-seconds, so Hubble would get
(3.3 / 0.04)2 = 6806 pixels for every Redcat pixel.
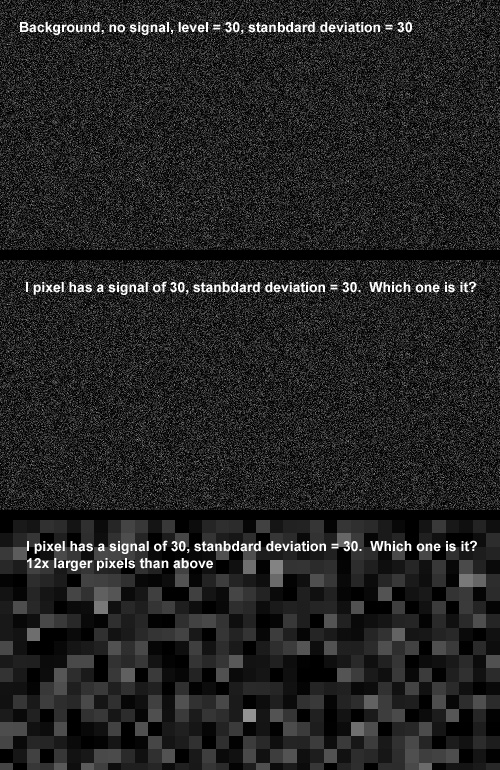
Figure 9a. One pixel in the middle and lower image has a signal / noise = 1.
Can you tell which one it is? Hint: it is not the one brightest pixel.
Figure 9a shows that one can't rely on one pixel with a S/N of 1 for
a confident detection, no matter how large the pixel is. But now
examine Figure 9b, where the S/N of each pixel is lower (S/N =
0.7) but more pixels are detecting the object. There is no binning
going on, but as the pixel count grows, the object detection becomes
better and better. So whether one bins or not, the effect of faint
object detection improves with the number of pixels on the object,
even when the signal-to-noise ratio per pixel is lower.

Figure 9b. Simulation with variable numbers of pixels, each with
Signal-to-Noise Ratio (SNR) = 0.7. Clearly as more pixels are on the
target, the target is better detected.
The beauty of having smaller angular size pixels, even with lower
S/N, is that one can choose to bin to improve resulting
single pixel detections, and/or not bin, or not bin in high S/N
area while binning in low S/N areas, thus keeping resolution and
detail where signal is high enough.
Thus, the light collection, and therefore the faint object detection
equation needs the number of pixels on the object when focal
length changes between systems. To compare light collection
and noise between systems, one needs to account for the different
angular pixel areas.
Light collected ∝ Number_of_pixels * pixel_area2 / focal_ratio2
To get the number of pixels on the object, one needs the focal
length and size of the object to be considered, and because focal
ratio includes focal length, the focal length cancels out and we
are left with aperture area and common (between systems) solid angle.
Pixel angular area = pixel_size / focal_length (result in radians)
Light collected ∝ Number_of_pixels * (pixel_size / focal_length)2 / (focal_length / aperture_diameter)2
∝ Number_of_pixels * pixel_size2 * aperture_diameter2
To get the number of pixels on a target (the target can be a star,
a nebula, a bird in a tree, or a set size, like one square are
second or 10 x 10 arc-seconds. The pixel size is expressed in angular size, like
arc-seconds and Number_of_pixels * pixel_size2 becomes angular
area, Ω. Then the light collection equation simplifies to
aperture area times angular area, the well known Etendue throughput
equation, the A Ω product.
In the case of Redcat 51 vs Hubble, each Hubble pixel sees 2.85
times less light but there are 6806 Hubble pixels for each Redcat
pixel, and faint signal detection is improved over the Redcat by
(68061/2/2.85 = 29 times better S/N on the same object
area, whether one bins or not. An example simulation is shown in
Figure 9c. The correct answer to the question which see fainter
objects, Hubble or the Redcat 51, it is clearly Hubble, even though
light per pixel is less with Hubble. If one binned Hubble pixels
2x2, the resulting binned pixel would have more light per pixel
(4 / 2.85 = 1.4 times more) than the Redcat system and have 0.08
arc-second per pixel, thus having 3.3 / 0.08 = 41 times higher
resolution.
The key takeaway here is that light per pixel is only part of the story.
How many pixel one gets on an object is important too, and when that
is included, light detection is the simple Etendue throughput
equation, the A Ω product.
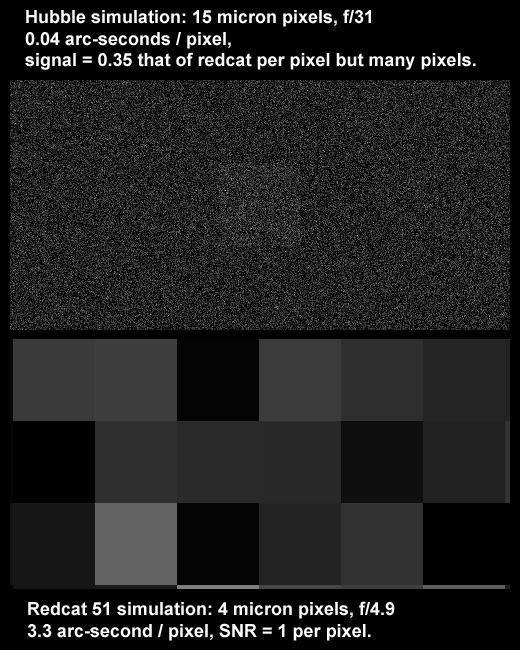
Figure 9c. Hubble vs Redcat 51 simulation imaging a 3.3 arc-second
square target. The Redcat 51 (bottom) per the text above sees one
pixel with a Signal-to-Noise Ratio (SNR) = 1, while Hubble (top)
sees per pixel only 0.35 the signal level and lower SNR per pixel.
But because more pixels are measured on the target, the detection of
the target becomes clearer. Signal per pixel and number of pixels
are both important for detection. The Redcat image (bottom) has
only one pixel on the target, and because the SNR = 1, it is not
possible to determine which pixel is the one with the target.
Hint: it is not the brightest pixeln this image.
Discussion and Conclusions
In this article I have presented observational data to show the real
parameters that affect light collection with an imaging system, and
presented the fundamental equations for predicting how much light would
be collected from an object in the scene. The fundamental variables do
not include f-ratio nor sensor size as commonly cited on the internet.
While f-ratio and sensor size correlate with some uses of cameras and
lenses, it is simply a correlation and not causation, so do not apply for
all scenarios. The actual parameters that apply are the lens/telescope
collection aperture (technically the entrance pupil), the solid angle
of the object to be imaged, the exposure time and the system throughput.
The Apple Pie Analogy and what this all means. Let's consider
making an apple pie. Should we use a large pie dish, or a small one
(analogy to a large sensor or a small sensor)? Well, it really depends on
how much pie filling we have (analogy of how much light we can collect).
If we have a large dish and a small amount of pie filing, the pie
will be very thin (analogy for large versus small camera sensors).
And whether we have a big dish or a little one, for a fixed amount of
pie filling if we need to chop up the finished pie into 100 pieces to serve 100 people,
each piece will have the same weight and everyone will get the same
amount of pie filling. (Analogy to large versus small pixels.) The way
to get more pie filling is to get more apples and other ingredients.
In photography, the ingredient is light. To collect more light there
are 3 ways for a given system efficiency: 1) increase exposure time but
that might show blur due to movement of the subject(s), 2) increase the
aperture diameter (but that might decrease the depth of field, and/or 3)
change distance (but that changes composition and perspective). For a
given location, only 1 and 2 change the light collection from objects
in the scene. The more light you collect, the finer you can chop up the
image to show finer detail, and that is controlled by 1 and 2. Often one
can't change distance, e.g. on the edge of a cliff, or safety getting
too close to wildlife, or scaring the subject. In portrait photography
getting too close distorts faces, like making a nose look too big.
And another pie analogy: say you only have little dishes and a lot of
pie filling. Simple: make multiple pies, and in the photography world,
that would be make a mosaic.
The aperture area times the solid angle is called the Etendue.
The Etendue is also called the "A Omega Product" and is used by optical
engineers to design systems, for example, consumer cameras or spacecraft
imaging systems. Etendue is the key to light collection.
The Etendue model applies to ALL photography. If you see a claim on
the internet of something changing/improving sensitivity, examine what
they changed in their experiment and see which parameters from Equation
5 or 6 they changed. For example, if you change distance to an object,
Omega changes. If you halve the distance, the object appears twice as
large and Omega increase by 4x, thus by changing distance, light collection
from the object will increase by 4x. But if you can't change distance,
or do not want to because perspective changes, then the only ways to
increase light collection is to 1) increase aperture area, 2) increase
exposure time, and/or 3) increase system efficiency (and increases in
system efficiency is very limited).
Larger sensors enable one to use larger lenses (longer focal lengths
without reducing field of view) at the expense of more bulk, weight,
and in terrestrial applications, smaller depth of field. For example,
if you are using a 50 mm f/4 lens on a 1.6x crop camera, and switch
to a full frame camera, you could use a 50 mm * 1.6 = 80 mm lens for
the same field of view. If you use f/4 on the 80 mm lens, your lens
light collection area increases by 1.62 = 2.56, and while
you get the same field of view, your depth of field is smaller. So while
the larger camera enabled one to collect more light, it is the lens
collecting the light; the sensor only records the light collected by
the lens. More on Etendue, light collection and depth of field is here:
Exposure and Digital
Cameras, Part 2 Understanding Exposure.
Binning effectively decreases f-ratio for a given focal length!
For example, binning 3x3 a 300 mm f/4 lens will effectively make
a 100 mm f/1.33 lens. For this to be effective, the camera must be
operating at an ISO that shows no banding artifacts.
For the daytime photographer, one need not use the equations and do
calculations. Say you want to image a bird in a tree and light levels
are low and there is some movement so exposure times can't be increased.
The lessons here guide one to choose the best lens for the situation.
In the low light situation, do you choose a lens with a faster f-ratio, or
one with a larger aperture, regardless of f-ratio? For example, which to
choose: an 80 mm f/2.8 or a 300 mm f/4? The 80 mm f/2.8 has an aperture
diameter of 28.57 mm. The 300 mm f/4 has an aperture of 75 mm. In the
same exposure time, the 300 mm lens will collect (75/28.57)2
= 6.89 times more light from an object in the scene in the same exposure
time. 1) Assuming the composition still works with the longer focal
length, I would choose the longer focal length, use manual exposure to
fix the exposure time to limit movement. 2) If the bird fills in the
frame but I wanted more space around the bird, and the tree is static,
I would do a quick mosaic (even hand held). Both methods would result
in a better image than using the faster lens. See my Mosaics Gallery for examples.
You will find birds in trees mosaics, as well as wildlife mosaics. In summary,
I choose the lens with the larger aperture diameter over considering
f-ratio in most situations. And of course, one would need to trade
time for a mosaic versus ease. For example, one could do a 10x10 frame
mosaic with a big lens like 600 mm f/4, or a faster 3x3 mosaic with
a 180 mm lens, or a 2x2 mosaic with a 120 mm lens, or a single frame
with a 60 mm lens. Final intent for the image is also a consideration.
If just a snapshot for the web, a quick 60 mm image would be fine, but
if you want to make big prints to hang on your wall, then a mosaic could
greatly improve impact.
Another terrestrial example is photographing an animal in a low light
situation and you must limit exposure time to prevent blur. The animal
fits in the frame of your 20 megapixel crop sensor camera with your
longest lens: a 300 mm f/1.4 with 1.4x teleconverter (thus 420 mm f/5.6).
Would switching to your full-frame 20-megapixel camera with the same
lens improve sensitivity and make a better image? NO! Light collection
would be the same because the lens controls how much light gets collected.
The crop sensor camera, with its smaller pixels will show
more detail (see example in Figure 4b).
From the Milky Way example in Figure 1, the internet wisdom of "use of a
wider angle lens to collect more light from the Milky Way" is shown to
be false. Another option for collecting light is to use a larger lens
and do a mosaic (stitching). For example, 2 minutes of exposure on the
Milky Way with a 15 mm lens at f/2.8 (Figure 1a) could instead be done
in about the same time with the same camera, but with a 24 mm f/1.4 lens
and four 30-second exposures mosaiced to cover the same field of view.
The 24 mm lens will record fainter stars and nebulae and the mosaic
will result in smaller stars, improved detail, and less apparent noise.
It is for these reasons that many nightscape photographers have turned
to making mosaics. You will see by examining my nightscape images, that I
often do mosaics with a 35 mm f/1.4 lens and take a little more time than
what a wider angle lens like a 15 mm f/2.8 lens would require. But the
result is a far better image with smaller stars, more stars and nebulae,
and less apparent noise.
Per pixel light collection. The idea of light Collection
per pixel ∝ pixel_area/focal_ratio2 is correct
for constant focal length, but breaks down when comparing systems
with different focal lengths. For systems with different focal
lengths the number of pixels on a target can change and the light
collection equation simplifies to aperture area times angular area,
the well known Etendue throughput equation, the A Ω
product, and aperture is the key metric between systems. Even in
the fixed focal length case, because f-ratio is the ratio of focal
length and aperture diameter, the focal length has been fixed, the
remaining variable is actually aperture, not f-ratio, and the area
measured, so again, the A Ω product. To be clear, the
pixel_area/focal_ratio2 is a convenient simplification,
but should not be used for comparing systems with different focal
lengths.
Appendix: Calibrate Your Camera
Why calibrate your camera? Calibration enables one to predict the
signal and noise in a future imaging session. For example, say that
the outer parts of a galaxy has a faint spiral arm at magnitude 22 per
square arc-second and you want to image that galaxy and the spiral arms.
What lenses and exposure time would be needed to get a good image?
We will use the light collection equation in equation 4 to illustrate
calibration of a camera. The reason to do this is to understand what
exposure one might need to collect enough light to make a certain image
when the brightness of a subject is known. This has general applications
for astrophotography where the brightnesses of astronomical objects is
readily known and can be gotten from free software like Stellarium.
It is a little more complicated, but it is possible to make prediction
regarding the light one could collect from terrestrial objects, like a
Cheetah on the Serengeti, but that is a topic for the future.
If you don't want to go through the math in the derivation, you can skip
this section.
Steps to Calibrate a Camera + Lens/Telescope
- 1) Choose an object with known intensity (e.g. Stellar Magnitude).
- 2) Make an exposure of the object.
- 3) Convert the raw file to linear data for each color pixel as separate tiffs.
- 4) Crop the linear images to show just the object and zero the background.
- 5) Determine the size in pixels of the object.
- 6) Select the object in a program like photoshop and get the average brightness in raw signal (DN)
- 7) Signal in step 6 * number of pixels in step 5 = total signal from the object.
- 8) Multiply by the gain in electron/DN * total signal from step 7 = total light in photons.
- 9) Determine the size of the object in square arc-seconds.
- 10) Total light from step 8 / size from step 9 = light per square arc-second for the exposure time.
- 11) Light per square arc-second from step 10 / exposure time = light per square arc-second per second (or other time unit)
- 12) Take out the lens aperture area and system efficiency:
Light from step 11 / (lens aperture area * SE)
- 13) Compute brightness of the object in magnitudes / sq arc-second
- 14) Combine steps 12 and 13 to give light for a specific brightness in magnitudes / sq arc-second
and correct to an integer magnitude.
- 15) Compute the light recorded for your target.
Let's use the Moon image in Figure 3d to calibrate the camera + lens used.
The Image was made on Sunday November 1, 2009 at 22:17:32 Mountain time,
USA. I started Stellarium and set that date and time and my location.
I found the Moon position and other parameters were:
Example Calibration with the Moon
1) Object: Moon: Nov 1, 2009, 22:17:32: Magnitude -12.32, extinction to -12.10,
apparent diameter: 31' 55.2" = 1915.2" area = 2880833.42 sq arc-seconds
illumination: 99.4%, solar distance: 0.995 AU = 148,812,000 km Earth distance: 374226.880 km
Altitude: 64 deg 23' 37.7" (apparent altitude with atmospheric refraction), Azimuth: 150 deg 45' 07.8"
Angular area = 2880833.42 sq arc-seconds * 0.994 illumination = 2863548 square arc-seconds.
2) Exposure: Camera: Canon 5D mark II (6.4 micron pixels), Canon 500
mm f/4 lens, 1/800 second exposure Camera ISO 200, Camera pixels =
5616*3744 = 21026304 pixels. Lens diameter = 500 /4 = 125 mm, or 12.5 cm.
3) Convert the raw file with Rawdigger to make 4 linear tiff files for the
red, green, blue and green2 channels.
4) Crop the linear green channel from rawdigger to just include the Moon.
Bonus: set the sky background to zero. On a linear image, it may be difficult
to see the Moon versus sky and the sky will be dark enough that any signal
from the sky is negligible.
5) Size of the object, the Moon: do this on a Bayer demosaiced RGB image so you
can easily see the boundaries. For the full Moon, one could measure the diameter
of Moon in pixels and then compute the area with (pi/4)*diameter2. I
wrote custom software that counted pixels and found 401636 pixels on moon.
6) Bring the cropped image into an image editor like photoshop and get
the average signal (in photoshop it is in the histogram tool, and the
values shown are 1/2 the actual values so multiply by 2). I found the
average signal in the image = 4665 (photoshop gave 2332). This is raw
Data Number (DN).
7) Total signal from the Moon = 4665 DN * 401636 pixels = 1,873,631,940 DN.
8) Camera gain (see below how to fine this) = 2.03 electrons / DN
Total light from the Moon 1873631940 DN * 2.03 e/DN = 3803472838 photons
Note, this is as if all pixels were green pixels. We need to do it this
way because the stellar magnitude of the Moon is for the whole moon,
not just 1/4 of it.
9) Size of the Moon = (pi/4)*diameter2, diameter = 31' 55.2" = 1915.2"
(the ' is arc-minutes, " is arc-seconds)
(pi/4)* 1915.22 = 2880833 sq arc-seconds.
Size of the illuminated moon = 2880833 sq arc-seconds * 0.994 illumination = 2863548 square arc-seconds.
10) Light from Moon per square arc-second:
3803472838 photons / 2863548 sq arc-seconds = 1328 photons/sq
arc-second per 1/800 second.
11) Convert to light per second:
1320 photons/sq arc-second per 1/800 second = 1328*800 = 1,062,400 photons/sq arc-second per second
This is for the full Moon (99.4% illuminated) with the 500 mm lens.
12a) Lens area, A = (pi/4)*12.52 = 122.72 sq cm.
12b) From photonstophotos, we see the quantum efficiency of the Canon 5D Mark
II is about 35%. I assumed the lens transmission is 70% for a system
efficiency, SE, of 0.35 * 0.7 ~ 0.25.
Light from full Moon incident on the lens: 1062400 /(122.72*0.25) =
34628.4 photons per sq arc-sec per sq cm per second (green channel).
13) The Moon's total brightness was magnitude -12.10 and covered an area
of 2863548 sq arc-seconds. This is from step 1. The Moon's surface
brightness was:
-12.10 + 2.5 * log10(2863548) = -12.10 + 2.5 * 6.4569 = 4.04 magnitude / sq arc-second.
14) Combine steps 12 and 13 to give:
34628.4 photons per sq arc-sec per sq cm per second for object with 4.04 magnitude / sq
arc-second for 4.04 magnitude / sq arc-second.
Correct to 4.0 magnitude / sq arc-second.
To get to 4.0, the signal should be 0.04 magnitude brighter.
The change in intensity is: 2.51189magnitude or 10(0.4*magnitude), thus
2.511890.04 or 10(0.4*0.04) = 1.0375, which gives: 34628.4 * 1.0375 =
35927 photons per sq arc-sec per sq cm per second (green channel, magnitude 4) incident on the lens.
15) For other brightnesses, the equation for the amount of light recorded is:
P = 35927 * 2.51189(4.0-M) * A * Ω * T * SE, (equation A1, same as 5b above)
where
35927 = derived constant in photons per sq arc-sec per sq cm per second (green channel, magnitude 4)
P = light recorded in photons,
M = surface brightness in magnitude / sq arc-second,
A = lens/telescope aperture area
Ω = the solid angle of the object,
T = exposure time in seconds, and
SE = system efficiency.
Result is in photons for the green channel.
Interestingly, the constant and equation is a reasonable approximation for daytime terrestrial
scenes in the early morning or late afternoon.
Equation 5 is a general solution that should work for any consumer digital
camera. Accuracy is on the order of 10 to 20%. To improve accuracy,
you would need to measure your own camera and adjust the 35927 constant
as needed.
Finding Camera Gain.
Gains for some cameras can be found in my
Reviews.
For example, the Canon 5D Mark II gain at ISO 200 =
gain: 2.03 electrons / DN (DN = raw file Data Number)
and is found in Table 1 here:
Canon 5D Mark II review,
For other cameras, gains can be derived from data on photonstophotos.net.
For example, go to the
Input-referred Read Noise and select your camera. For the 5D2, ISO 200,
the site gives a read noise value of 13.737 electrons. Now do the same for
Read Noise in DNs where it shows for the or the 5D2, ISO 200,
6.869 DN. The gain is then 13.737 / 6.869 = 1.99985, or 2.0 electrons/DN, only about
1.5% different from my derived value.
Getting the Linear Camera Raw Data Values.
Using the program rawdigger to analyze the raw data file, one of the green channels
had an average signal in the image of 22.27 Multiply that value by the
gain and number of pixels to get 950.8 million photons. One can assume
in this case that the sky is zero. I analyzed sky and Moon with a custom
program and found that the sky contributed no more than 1% of the signal,
so using an image average works in this case. This number of photons
is for one green channel which covers 1/4 the sensor area. If all the pixels
were the green channel, we would get 4*950.8 = 3803.2 million photons
from the Moon.
Getting Omega, the Object's Solid Angle.
There are two easy ways to obtain the solid angle of an object.
1) For the nearly full Moon, use a program like Stellarium to get the diameter
of the Moon at the time of your observation and the illumination factor.
For the Moon images in Figure 3, the apparent lunar diameter: 31' 55.2" = 1915.2 arc-seconds
with 99.4% illumination. The the solid angle was:
Ω = (pi/4) * diameter2 * illumination factor = (pi/4) * 1915.22 * 0.994
= 2863548 square arc-seconds.
2) Another method measures the solid angle from an image.
500 mm f/4 lens plate scale = 2.640 arc-seconds /pixel = 6.97 sq arc-seconds /pixel
Lens: 125 mm diameter lens = 122.72 sq cm
Measured from the image: 401636 pixels on moon with the 500 mm lens.
Ω = 401636 pixels * 6.97 sq arc-seconds/pixel = 2799403 square arc-seconds.
This values agrees with the above calculation to about 2%.
From Table 1, above, the Moon covered 2880833.42 sq arc-seconds, so one
square arc-second would give:
observed signal = 3803,100,000 photons / 2863548 sq arc-second = 1328.2 photons / sq arc-second.
Calibrating Using Stars. Stars in reality are extremely small in apparent diameter,
but what we observe through the Earth's atmosphere and an optical system
are blurred into a small fuzzy disk. Stars in a camera/telescope image are
not single pixels (unless the camera pixels are extremely large and
there is no blurring filter over the sensor. Stars are typically 3 or
so pixels in diameter (not including saturated stars). So to analyze
stars instead of the Moon, simply treat the star images like little
disk similar to the moon. Choose a diameter over which to sum all the
signal from a given star and sum the same sized area next to the star
that only shows sky and subtract the sky signal from the star+sky.
You can use the V magnitude of the star in equation 5 and use Omega =
1 arc-second to compute the signal from stars of different magnitudes.
The calibration here is for the green channel, which is close to the V-passband
used in astronomy and reported as V-magnitudes. The red and blue in a consumer
digital camera do not correspond to the red and blue filters used in
standard astronomical photometry, so calibrating those channels
is best done by using the star Alpha-Lyra. Alpha Lyra is defined to be
stellar magnitude zero at all wavelengths. Using equation 5a, one can then derive
the Ka constants for the red and blue channels.
If you find the information on this site useful,
please support Clarkvision and make a donation (link below).
References and Further Reading
Clarkvision.com Astrophoto Gallery.
Clarkvision.com Nightscapes Gallery.
Notes:
DN is "Data Number." That is the number in the file for each pixel. It is a number
from 0 to 255 in an 8-bit image file, 0 to 65535 in a 16-bit unsigned integer
tif file.
16-bit signed integer: -32768 to +32767
16-bit unsigned integer: 0 to 65535
Photoshop uses signed integers, but the 16-bit tiff is unsigned integer (correctly read by ImagesPlus).
The Night Photography Series:
http://clarkvision.com/articles/exposure-f-ratio-aperture-and-light-collection/
First Published December 7, 2020
Last updated December 6, 2025