ClarkVision.com
| Home | Galleries | Articles | Reviews | Best Gear | Science | New | About | Contact |
Color Astrophotography and Critics
by Roger N. Clark
| Home | Galleries | Articles | Reviews | Best Gear | Science | New | About | Contact |
by Roger N. Clark
Producing natural color astrophotos has multiple challenges and there are methods to deal with those challenges. I advocate a simpler modern method that allows one to produce very good images with a modest amount of time and equipment. Evidence from many users over several years show that it produces excellent results and color. Contrast this to some "traditionalists" who often mangle color because they do not understand all the subtle issues involved. In this internet age, there are "traditionalists" that attack the modern method. Unfortunately, their own traditionally touted methods have approximations, ignore critical steps, resulting in pitfalls which they seem to be unaware of, and that generally produces worse color. But to be clear, an informed user can produce great color using different methods, and an uniformed user can mangle color, regardless of method used. In this article, I'll address some of the issues in producing consistent and natural color.
The Night Photography Series:
Contents
Introduction
Color Definitions
Science is Important
The Modern Method Of Astrophotography Color Production
The Traditional Method Of Astrophotography Color Production
Be Wary of Extremists with Personal Attacks
Better Color Workflow for Consumer Digital Cameras
Color and Light Pollution Filters
The Bane of All Astro Processing: Skyglow and Skyglow Gradients
Discussion
Conclusions
Appendix 1 Sample Images: NASA APOD and Images by Others Using My Modern Methods
References and Further Reading
Producing consistent color of objects beyond our Solar System is challenging from the Earth's surface. These challenges are much greater than producing good color from a digital camera of daytime objects, including landscapes, and portraits of people. Modern digital cameras can produce beautiful images of landscapes, indoor scenes, and pictures of people and animals, even straight out of camera. Modern digital cameras can also produce natural color images of stars, nebulae and galaxies, but it is much more complicated requiring post processing. To photograph objects beyond our Solar System we must look through our atmosphere to detect very weak signals. Our atmosphere glows (airglow) at night, reflects light from man-made lights (light pollution), and absorbs the distant light as it passes through the atmosphere. In all but a few bright nebulae and galaxies, most light from distant objects is many times fainter than the airglow and light pollution. Even very far from cities, and high mountain tops where there is no light pollution, airglow, which occurs above about 90 km (56 miles) above sea level, is still usually a major signal swamping faint astronomical signals imaged in visible color.
The modern method that I describe uses modern digital camera raw converters to produce a color image, exactly the same as one would do for a daytime landscape image, or a portrait of a person. But astrophotography has an added problem: light pollution and airglow is an unwanted signal. It is like making a daytime landscape photo on a foggy day, but the fog is strongly colored and you want an image of a clear-day view with no fog or haze.
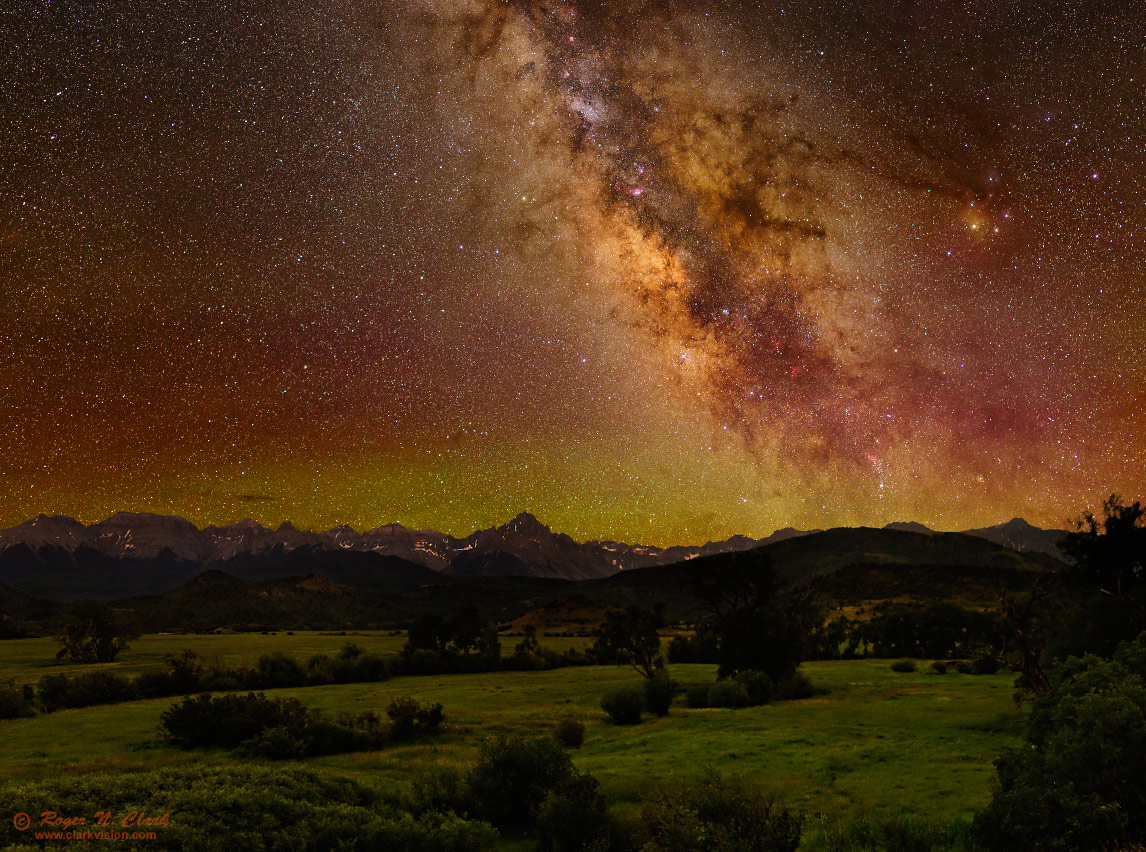
The problem of removing light pollution and airglow, collectively called skyglow, is a linear process: light pollution should be subtracted from the signal recorded by the camera. Critics of the modern method accurately say that such a signal should be subtracted from a linear signal and I get criticized for doing it on tone curve data. They argue that it causes color shifts and provide mathematical examples showing a shift to green. But my images don't show such color shifts! Figures 1 and 2 are examples. The problem is, color has many approximations, and using photometric data on stars, galaxies and nebulae, one can mitigate problems and verify color accuracy, and when one does that, we find the critics of the new method have usually ignored critical steps in their own evaluations and made invalid assumptions, including mangling color with their own traditional methods. I will discuss these problems.
To be clear: the vast majority of amateur astronomers understand the problems I discuss below. I am addressing this article to the few vocal and sometimes vitriolic people who try and destroy reputations pushing their methods as the only true method. Ironically, we'll see they often produce mangled color with their "one and true method" creating confusion in the astrophotography community. Also, I do not claim that my modern method is the only method that can produce excellent color. But if you see forum posts with links to the "extremists" please post a link to this article so people see some balance.
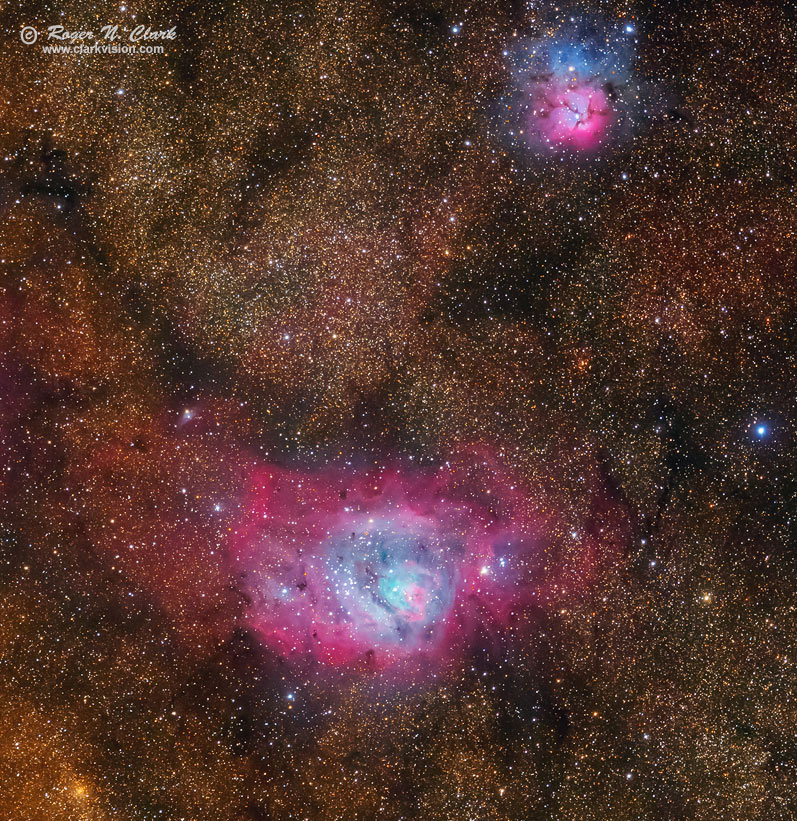
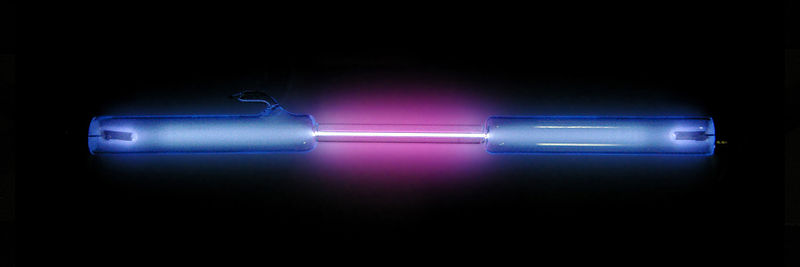
When I first started showing natural color images from DSLRs circa 2004-2013, I was criticized by some amateur astronomers because they said my colors of hydrogen emission nebulae were wrong. "Everybody" knew hydrogen emission was red. Not. The amateur community commonly colors hydrogen emission nebulae very red, because they typically imaged (in that era) with cameras that were more sensitive to the red hydrogen alpha than the color of DSLRs and human vision, but such high hydrogen-alpha sensitive systems are not the natural color. Visually, I and many people I have surveyed have seen the pink hydrogen emission in nebulae. I have seen the beautiful pinks in M8, the Lagoon Nebula, M20, the Trifid Nebula, M42, the Great Nebula in Orion (see Figure 5 below) and other nebulae. The real color of hydrogen emission is shown in Figure 3, and the color is due to a combination of blue hydrogen beta and hydrogen-gamma emission and red hydrogen-alpha emission making magenta. Add in some emission from other atoms (like teal emission from oxygen) and we get lighter pink. Then in some locations interstellar dust, which absorbs blue more than red, changes the magenta to red. And that is what we commonly see: magenta pink grading to redder in the outer portions of nebulae when interstellar dust absorbs the blue (seen in M8 and M20 in Figure 2 where we see that the colors are consistent with known science).
We know the colors of objects in the night sky by the spectra of those objects and the known spectral response of the human eye. Indeed, with different telescopes and sky conditions, many of the these colors can be directly verified visually by people with normal vision. Many objects in the night sky can show color, including hydrogen emission nebulae, planetary nebulae and stars. The main inhibitor to detecting color visually is low contrast due to airglow and light pollution, and lack of good dark adaptation (see Part 6: Color Vision at Night for lighting, dark adaptation, and color sensitivity).
True Color. Color and contrast as close as possible to the human visual system. The wavelengths recorded match that of the human eye.
Natural Color. What most film and digital camera daytime images are--color spectral response that is close to the human eye response, but may be different in contrast and saturation. The 3 colors can also be converted to black and white in various proportions to change contrast. The wavelengths recorded reasonably match that of the human eye.
Enhanced Color. "Extreme" or strong pushing of contrast and/or saturation. There is a continuum between natural color and enhanced color. A daytime landscape image is typically natural color that has been enhanced some. A portrait of a person is typically less enhanced. Fujichrome Velvia film might be considered enhanced color.
False Color. Includes color outside of the visual passband. For example False-color IR photography includes near infrared. Mid-infrared or ultraviolet imaging are also false color. A black and white image may also be produced from wavelengths outside the visual passband. Most Hubble Telescope images and most images from professional observatories are False Color or Narrow Band Color. Most of my professional scientific work is false color and narrow band (most commonly narrow bands in the infrared). False color imaging is done to show different chemistry or processes and they can also be beautiful photographs.
Narrow Band Color. Use of narrow passbands to isolate particular properties, typically for imaging a specific composition. Narrow band can be entirely inside the visual range, outside the range, or both. Narrow band can also be black and white (e.g. an image at one wavelength).
All the above are legitimate imaging options. True color is the hardest to achieve, and is not actually possible with current technology with some unusual spectral content. It probably comes closest in portrait photography as people generally want accurate skin tones.
All forms of the above can make beautiful and stunning images.
I am a scientist and professional astronomer, see about me. I strive to be accurate and will correct things that are shown to be incorrect. However, I will also defend methods that I know to work well even though may be misunderstood by others. This article is about such cases--in fact extreme cases where there have been extreme personal attacks about me online. Inappropriate attacks must be countered or science loses.
The modern method of data reduction I teach for producing color images of the night sky is simple: Use a modern raw converter, just like you might use for a daytime landscape image, an indoor scene, or a portrait. One could even use out of camera jpegs (OH the heresy!). Section 3 of my astrophotography series gives details, including responses to critics.
3a1) Nightscape and Astrophotography Image Processing Basic Work Flow shows the basics.
3a2) Night Photography Image Processing, Best Settings and Tips shows more details.
3b) Astrophotography Image Processing illustrates the method on a deep sky object, and includes an appendix addressing controversies. There I show that the typical workflow produces color within photon noise and that the new versus traditional workflow can produce virtually indistinguishable results (see Figure 7c in the article).
3c) Astrophotography Image Processing with Light Pollution works an example with a skyglow gradient, and gives a challenge for people to show the best way to process the data. A number of people took the challenge using the traditional method (links to long discussions are given on the above page). A summary of some results are in Figure 9 in the above link. NOT ONE TRADITIONAL METHOD ATTEMPT PRODUCED ACCURATE NATURAL COLOR, NOR WAS ABLE TO BRING OUT NEBULOSITY AS FAINT AS THE NEW METHOD. I still welcome attempts to do better. Note that many of those ranting against me have not taken the challenge (that is a hint of their supposed expertise).
3a3) Astrophotography Post Processing with RawTherapee shows a newer version using a raw converter that does better on stars, producing even better color, more detail, and lower noise. I continually strive to improve the methodology. Many people are now using this workflow.
2d1) Verifying Natural Color in Night Sky Images and Understanding Good Versus Bad Post Processing includes what the critics are missing: my method uses color photometry data to help ensure the color is natural and consistent (see Figure 5 in the article).
2e) Verifying Natural Color Astrophotography Image Processing Work Flow with Light Pollution shows a constructed test using standard color charts. Again, the method produces accurate color, as accurate as any digital camera can in a normal daytime environment. I give the raw files so anyone can try their own method. The traditional astro image processing method fails miserably in this test. I'll explain why below. You won't find the critics doing this test and posting their results because their method fails so badly.
3f1) Advanced Image Stretching with the rnc-color-stretch Algorithm is free software for stretching and maintaining the color that is in the original data. This is free open source software with source code. Many people use the software and it has been used in a number of NASA Astronomy pictures of the day.
The traditional method of astrophotography uses basic equations. First subtract electronic dark levels and electronic bias for both the object under study and a uniform field (called a flat field). I describe these in detail Technology advancements for low light long exposure imaging and in professional papers, like this one where I calibrated NASA Cassini Spacecraft data (I was a member of the science team): Clark scientific publication 309: The VIMS Wavelength and Radiometric Calibration 19, Final Report, NASA Planetary Data System, Cartography and Imaging Sciences Node (pdf). This later document gives more detail in equations 1-4, and includes a higher level calibration than probably most amateur astronomers do, or need to do.
In the traditional Method, the calibration is done for each color channel independently, and the 3 color results combined to make a color image. Note that there are variations when not using a DSLR or other consumer digital cameras that may include a no filter (luminance) channel. Variations also include narrow band imaging, UV and IR imaging (which is most of my professional work), but such images are not natural color and I have not seen them passed off as such. I will only discuss here production of reasonably-natural color, like what we get from digital cameras in everyday life.
The problem is that the traditional method does not include a critical step required for processing digital camera data, e.g. mirrorless or DSLR images into natural color. The vocal critics seem to not be aware of this problem.
And the interesting thing is that the modern method with modern raw converters do these basic traditional equations too. They subtract the darks, and divide by a flat field (in the lens correction). And they do the critical additional step required of digital camera data to produce natural color (discussed below).
Now to the critics.
I have advocated simplified methods that, even with approximations, produces better and more consistent color in astrophotos than traditional methods. This simpler modern method allows one to produce very good images with a modest amount of time and equipment. I have developed methods where people can use free software, and even written my own software that I have made open source and free. This has certainly drawn the ire of some who can't see out of their old methods if their life depended on it, and others who are trying to sell software advocating their way is the only true way. It is not.
There are traditional astro software websites claiming good color calibration. Some traditionalists claim the modern method produces incorrect results. Unfortunately, and ironically, it is the traditional method that has been applied by some amateur astronomers, including commercial astro software vendors, who have ignored major factors in natural color reproduction from modern digital cameras. Some have also misunderstood the modern method and create examples to show problems that the modern method, if applied correctly does not have. Some critics say I don't understand best practices and the traditional method.
Background: as a professional astronomer, I do know and use the traditional workflow methods, probably better than most amateurs, as I discussed above with scientific references. I calibrate many kinds of instruments, including laboratory, field, aircraft, and spacecraft imaging systems and spectrometers using traditional methods. I led the calibration of one of the NASA Cassini instruments (see publication 309 on my publications list, link above). It is extremely offensive to me to have my method called pseudo science when in fact it is not only based on science, it has demonstrated to produce better and more accurate color than the traditional method. There are basic reasons why the traditional method fails as applied by the typical amateur astronomer for consumer digital camera data because online tutorials have missed a crucial step, including those by commercial software vendors.
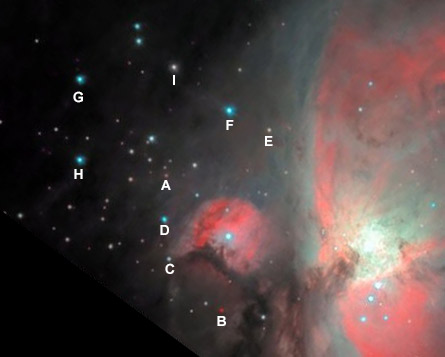
Let's look at an example of the traditional method of producing color in astrophotography. Startools claims on its web site "mathematically correct color calibration of stretched data." Here is one youtube tutorial processing DSLR data for the Great Orion Nebula, M42: StarTools simple image processing workflow tutorial with real-world, imperfect data. Look at the image at 11:05 and 13:55 into the video. Notice that the startools result shows a bizarre red-orange hydrogen emission color. Most people with normal eyesight who have looked through a moderate to large telescope from a dark site can see the characteristic pink of the hydrogen emission in bright nebulae like M42. The wikipedia image (Figure 3, above) also shows the natural color of hydrogen emission, showing that the color in the startools method is drastically wrong. Scientifically, there are no hydrogen emission lines that can produce the ugly orange in the startools "color calibrated" image.
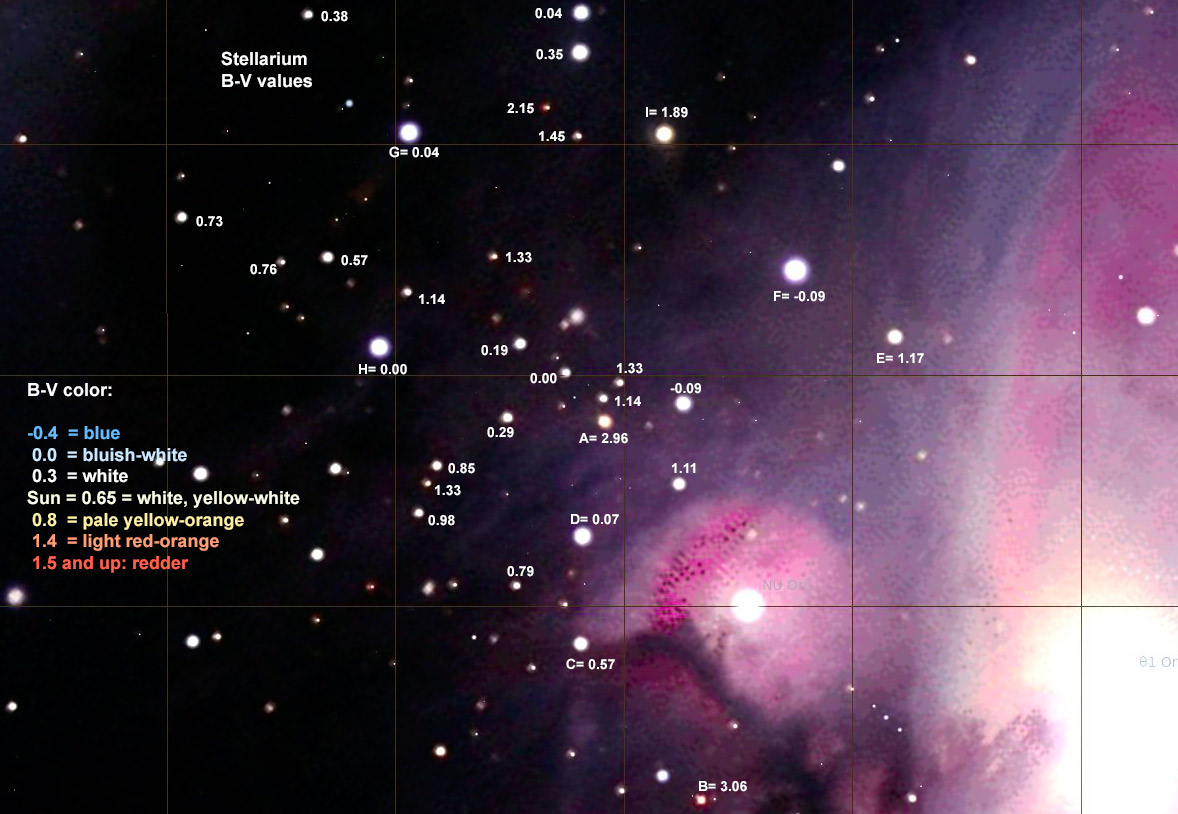
So much for traditional color accuracy. But there is more evidence. Figure 4 shows some B-V values for some stars in the M42 area. B and V are the blue-ultraviolet (B) and Visual (V) stellar magnitudes (a log scale). Look at stars labeled C, D and E in Figure 4 and 5 and find them in the startools video above and in Figure 6. Startools has all three stars blue in color, but star C (B-V = 0.57) is very close to that for the Sun, so should be white/yellow-white. Star E (B-V = 1.11) should be orange-ish, not blue. Star D (B-V = 0.07 should be white-bluish-white. So the "color accurate" method of startools is not accurate at all! The traditional method failed to produce natural color as applied by this method. In contrast, the star color done with the new method, Figure 5, shows color close to that expected from stellar photometry, real science.
Now that we have an index of expected star colors, we can compare them to images. Figure 5 shows a single 1-minute exposure from a DSLR: a Canon 7D Mark II with a 300 mm f/2.8 lens.
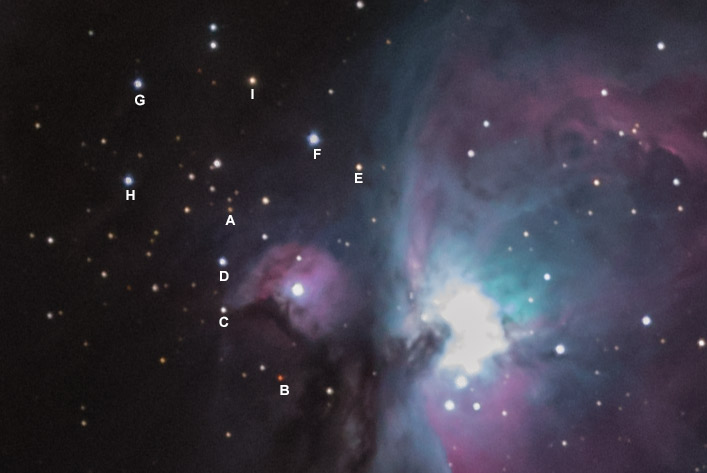
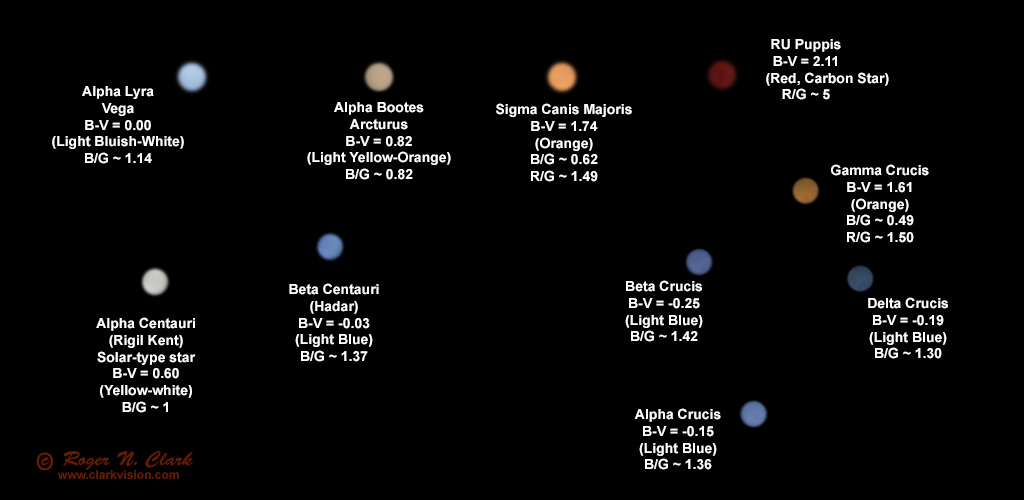
Now compare the startools result in Figure 6, where we see unnatural orange hydrogen emission. THESE COLORS ARE BAD. Now compare star colors. Look at stars D, F, G, and H with B-V = 0.07, -0.09, 0.04, and 0.00 respectively. These stars should be bluish-white, not the unnatural cyan in the Figure 6 startools result. The new method, however, produces bluish-white stars (Figure 5). Want to confirm the colors? Look at Vega (Alpha Lyra), which has B-V = 0.0 (Figure 7). Try looking at it out of focus in your telescope. To me it looks bluish-white, not cyan, just like the image of Vega in Figure 7. I have never seen a cyan star, nor is one expected based on known stellar spectra -- again based on science.
It should be painfully obvious by now that the "color calibrated" traditional method illustrated by startools is not close to natural color, but the new modern method is for more consistent with scientific data. Star colors are actually easy to record with the lens/telescope slightly out of focus, as illustrated in Figure 7. Viewing out of focus stars with binoculars or a telescope also makes the colors easier to see. My own viewing of bright stars out of focus in a telescope also shows colors similar to those shown in Figure 7.
So why is the traditional method so bad? I'll answer in the next section.
The traditional data reduction of astronomical images was correctly developed. It is the method I use when calibrating spacecraft data to do photometry and science. But the method as typically applied does not produce accurate visible color because it lacks a key step. It was designed by astronomers to make photometric images for science analysis.
Visual color as seen by humans is very different than scientific photometry. DSLRs have 3 color filters, but manufacturing the tiny color filters, which are only one to a few microns across for millions of pixels is challenging even with today's technology. The result is imperfect color response that includes light from other wavelengths. For example the blue filter includes light from green and red wavelengths. The green filter includes too much light from blue and red wavelengths, and the red filter includes too much light from blue and green wavelengths. This is called out-of-band response.
Besides out-of-band color filter response, human color perception is complex. The response is non-linear and response in one color can suppress response in another color. Thus, elaborate models of the human color system have been developed, and these are only approximations. See: Color Part 1: CIE Chromaticity and Perception and Color Part 2: Color Spaces and Color Perception for more information. There you will find color depends on the color model, color space, and output device used to view the image. However, these are small compared to the large problems we see in producing color images of astronomical objects seen through skyglow. Depending on the color model, color space and viewing device, blues will still be blue, reds will be red, etc, just slightly different reds and blues and not the hue changes we see in astronomical images, where we often see shifts like that seen in Figure 6, or worse: e.g. reds, oranges, yellows, greens, and whites turned blue.
The traditional workflow used by amateur astronomers does not correct for the out-of band response in the Bayer color filter array in consumer digital cameras, so the color output is cross-contaminated, thus incorrect color and low saturation. The idea that amateur astronomers have is to multiply the three color channels by different factors to "color calibrate" but this does not correct for out-of-band response! They then pump up saturation to try and overcome the low color saturation they observe. Depending on the nature of the out-of-band response, the result can be wildly inaccurate color, like that seen in the startools result in Figure 6. Often a step is included that aligns the histogram peaks of each channel, which includes adding different offsets and multipliers to the different color channels, resulting in variable color balance with scene intensity, thus very mangled color. Sometimes the result is horrible (like Figure 6, and even worse).
What is missing in the traditional astro processing workflow, and missing in the startools workflow is the correction for out-of-band response. This correction is called the color matrix correction and it is only an approximation to try and come up with "accurate" color. This correction is in every modern raw converter and is applied in camera to produce out-of-camera jpeg images, and in the raw converter when you convert your raw images (e.g. in Photoshop and Lightroom Adobe Camera Raw, ACR, or Rawtherapee or other converters). It is also a fundamental step in making an image from a smartphone. This is a fundamental step needed to even come close to reasonably natural color. Again it is ironic that the some "traditionalists" rant about the modern workflow when their own method forgot this crucial step and produces horrible color as a result.
Details of the color matrix correction are discussed here:
DSLR Processing - The Missing Matrix.
More details are here:
Color: Determining a Forward Matrix for Your Camera.
Every wonder why a camera raw converter does not work when you get a new digital camera? A major reason is the raw converter must include the new color matrix to do accurate color extraction from the raw data. The camera manufacturers should embed the matrix into the raw file, but they do not (the matrix is only 9 real numbers). This means for traditional astro processing, to include the matrix correction, one must find the matrix on the internet somewhere, or derive it yourself for your camera, then apply it as a custom step in your processing workflow. Then the question to ask, is your astro processing software capable of applying such a matrix correction? Different raw converters may use a slightly different color matrix correction, producing a slightly different color, but again these are minor compared to the traditional workflow that does not include a color matrix correction.
There are additional issues with color production, including color spaces and tone curves, as well as the specific monitor the image is viewed on. These are small effects compared to not applying the color matrix correction at all (as evidenced between Figures 5 and 6). And there is another major factor that all methods in astro processing suffer from: the elephant in the room is skyglow and skyglow gradients.
Deriving accurate color when using light pollution filters is quite difficult. Light pollution filters have strong absorption at wavelengths where light pollution is strongest for typical mercury and sodium vapor street lights, but have high transmission at the wavelengths of emission nebulae. Some astrophotographers advocate doing a custom color balance with the filter. However, this is about as effective as doing a color balance in the traditional workflow: there is no correction for out-of-band response. Because the filter changes the out-of-band response, a custom derivation of a new color matrix correction is needed. As noted above, this can be done with the help of the following article: Color: Determining a Forward Matrix for Your Camera. The derivation of the color correction matrix needs to be done for each camera and filter combination. Without that, color can be way off. Note too that the effectiveness of light pollution filters is decreasing as more cities move to LED lights, which are broad band and can't be filtered out. If accurate natural color is important to you, I do not recommend the use of light pollution filters.
Light pollution and airglow, collectively called skyglow, is a bright signal compared to many deep-sky objects (faint stars, galaxies and nebulae). Faint detail is commonly 100 or more times fainter than skyglow. Many astronomers, both amateur and professional, push detections to the limits of their time and equipment striving for recording fainter objects. When a galaxy, galactic arm, or nebula is 100 or so times fainter than skyglow, the accurate determination of the skyglow level is critical to get the red, green, and blue levels correct in order to derive accurate natural color. It is a non-trivial problem of making the assessment, regardless of method used. For example, for signals 100 times fainter than the sky that you are trying to detect, a 1% error in sky glow equates to a 100% error in the signal level from that object, and with differing levels for red, green and blue skyglow, that error can translate into huge errors in derived color, even with or without color matrix correction. Errors in sky glow corrections are the largest source of color error in faint objects in my assessment of images online, again regardless of method, or user, including my own. The graphic in Figures 8a - 8c illustrate the problem.
The color bars in Figures 8a-8c represent the skyglow in the red, green and blue channels of the camera. The gray bars represent color neutral objects in the sky (e.g. solar-type stars). Skyglow in the original data is shown in Figure 8a. Figure 8b illustrates subtraction of most, but not all skyglow, leaving a reddish background.
Many tutorials on the internet teach to "neutralize" the background -- make it gray. When there is a residual background (e.g. from skyglow, or real deep space signal from interstellar dust) the neutralization step reduces the high color and amplifies the low color, whether real or not. For example, if not all the red skyglow is subtracted, as shown in Figure 8b, red gets reduced and blue amplified when neutralized (Figure 8c). When the image is stretched, that amplified blue becomes more prominent. The result is mangled color and color shifts with scene intensity, This also has the effect of suppressing H-alpha signals, leading some amateur astronomers incorrectly saying one needs special modified cameras to record H-alpha. See Do You Need a Modified Camera For Astrophotography? for more information.
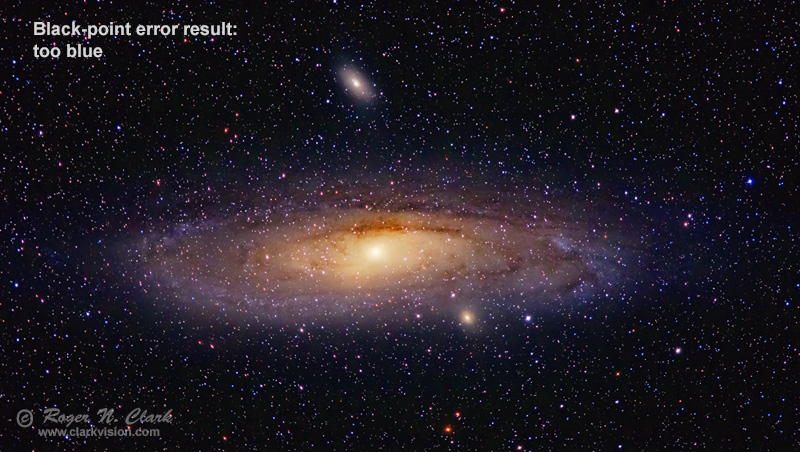
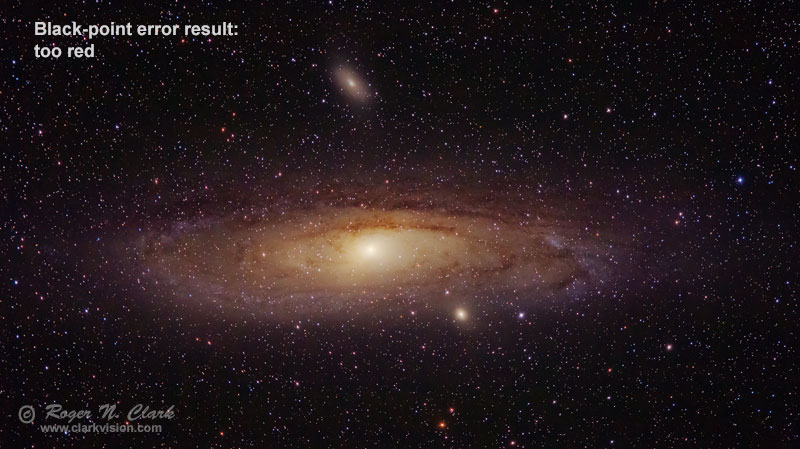
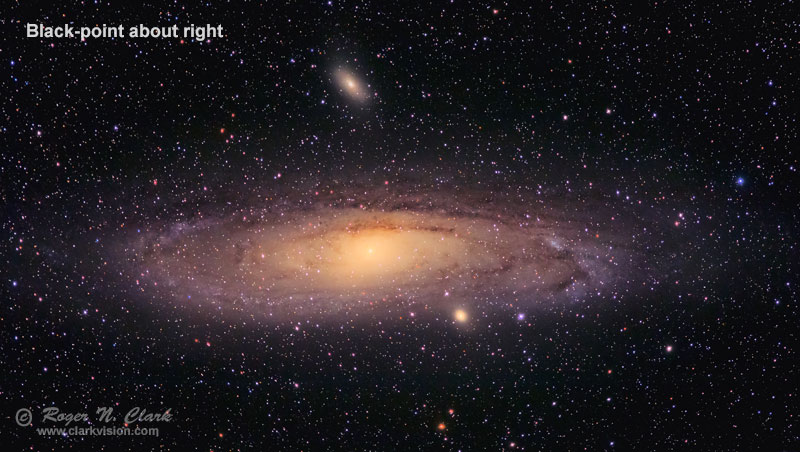
The web is full of illustrations of color errors due to inaccurate skyglow estimates. Here are examples, 1) NASA APOD 2016: Lynds Dark Nebula 1251 and 2) NASA APOD 2025: Lynds Dark Nebula 1251. The bluing as the scene gets darker is not real. How do we know? Interstellar dust is reddish-brown, and gets redder where the dust is thicker. As the dust thins, there is no mechanism by which it would turn blue, except if the grain size became extremely small making Rayleigh scattering (like in our daytime blue sky). But to see Rayleigh scattering, we need a star that is not red at an angle to induce the scattering. We see no such star in the above images. Here is a better rendition without the bluing: NASA APOD 2022: Lynds Dark Nebula 1251. When multiple stars shine through the nebula, the most common situation, Mie scattering is seen, which is commonly neutral to yellow-red like haze and smoke around the sun at sunrise or sunset. Another example: view the full Moon in a very clear night sky. Away from the Moon, the sky is blue from Rayleigh scattered moonlight, but close to the Moon the sky is not blue and a longer exposure will show that the scattered moonlight is bright and yellowish -- Mie scattering. You will see this from the highest mountain peaks in the clearest air too, and even from high altitude commercial aircraft. Again, science points the direction, and we can often deduce when we have an incorrect level in the skyglow subtraction: a black-point error (example below with M31 and Figures 9a-9c; another example with M22 is here where the background is bright reddish-brown interstellar dust).
Compare these NASA APOD images of the same region:
Stars and Dust Across Corona Australis:
1) Good color, and
2) which shows a color gradient due to a black point error.
Note that in the first image, the dust shows the same color as it fades
into the background. The globular cluster NGC 6723 at upper right shows
color consistent with B-V values in the first image. The second image
has a bluish-purple sky background and color of the dust changes as it
fades into the background indicating a black-point error. The globular
cluster is also bluer than indicated by
the NGC 6723 B-V values thus, there is also a color shift away from
natural color (to be fair to the author of the image, it may not have
been intended to make a natural color image, but simply to make a pretty
color image).
My own images are not immune from this black-point error problem either. As I have come to understand this problem better, I see I need to reprocess some of my older images to better correct for skyglow.
A black-point error example with M31, The Andromeda galaxy. The B-V color index of M31, the Andromeda Galaxy is 0.92, and that signal is dominated by the brightest part of the galaxy: the core region. Thus, the color of the core region is yellowish, yellower than our sun. Just like the Milky Way, M31 is dominated by cooler stars than the Sun, thus yellow. Add in reddish-brown interstellar dust and we see yellow-brown. Figures 9a, 9b, and 9c shows the processing of the same M31 data and differing amount of skyglow in each color, producing significantly different results. These and similar results have nothing to do with whether the camera data was processed with traditional workflow, or modern workflow. The color of faint stars and nebulosity is dominated by the choice of the skyglow color that gets subtracted. Indeed, a search of M31 on astrobin.com will show even larger variations in color, despite the type of workflow. Figure 9c shows my best attempt at getting natural color for M31. We often see galaxies with very blue spiral arms. Such hot stars have short lifespans, inconsistent with a dominant star color making blue. So there is a scientific reason there are so few visibly blue stars (less than 1%) in our galaxy, and those similar to our galaxy.
If there were no skyglow to subtract, it would be a lot easier to make color images of the Milky Way and other deep sky objects beyond our Solar System. Indeed, occasionally there are nights when airglow is very low. I encountered one such night recently when at a very dark site, high in the Colorado Rockies, and no apparent light pollution, the skyglow was about 3 times lower than common from this dark site. I made a short 10-second image of the Milky Way (Figures 10a, 10b, 10c).
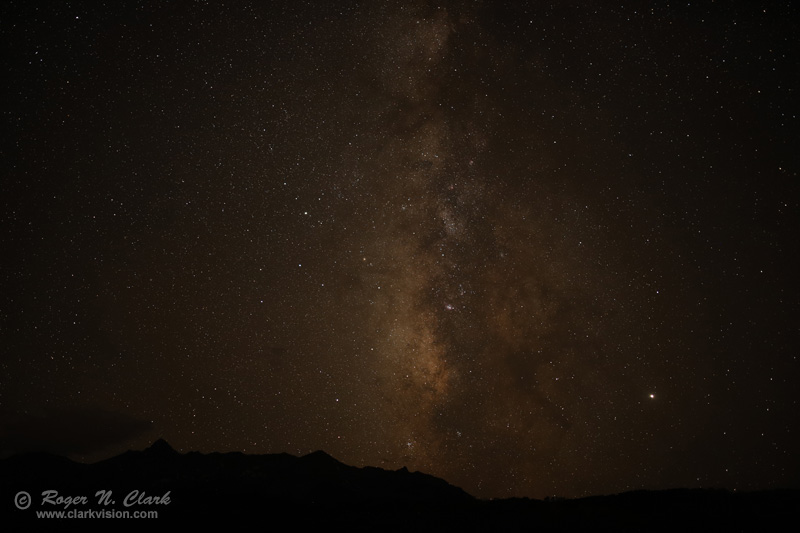
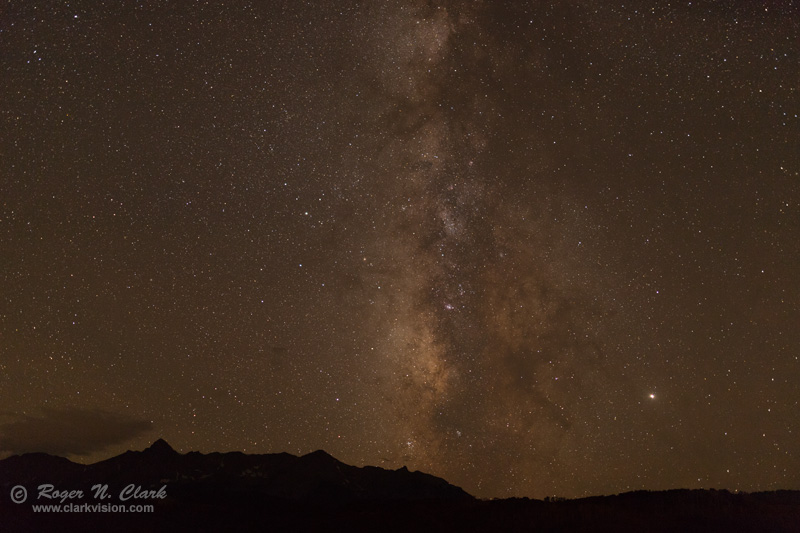
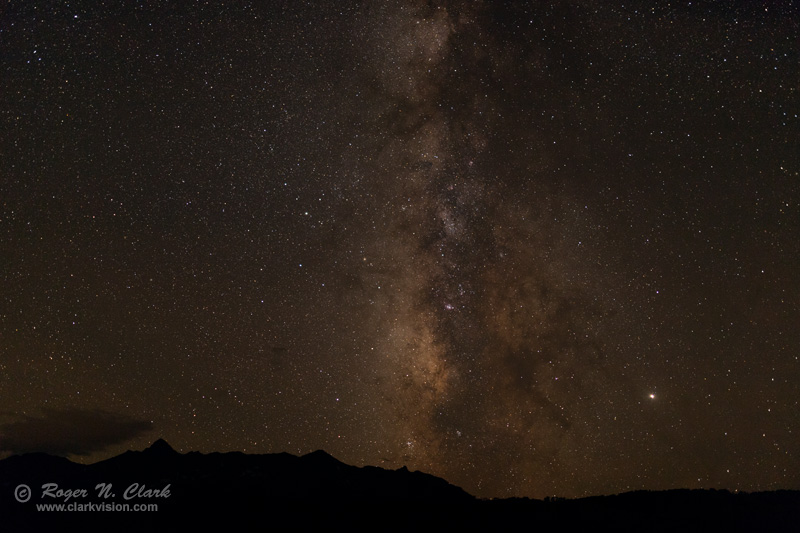
Comparing the colors in Figures 10a, 10b, and 10c, we see they are basically the same, yellow-brown for the Milky Way, but with small changes. These difference are due to the choice of color of skyglow to subtract (or not subtract), and the specific color model used (Canon's out-of-camera daylight white balance jpeg engine is different from ACR CS6's engine).
Producing natural color of deep space objects with consumer digital cameras requires close attention to process and science data for those and/or typical objects, including checking expected star colors using color photometry, both bright and faint stars, and understanding of color shifts with scene intensity regardless of processing method. Accurate color is dependent on both color balance and deep-space black point.
Color Matrix Corrections. Traditional processing must include color matrix corrections specific to the camera used if you want natural color. Note that color matrices found online or with camera raw converters use an approximation matrix designed to give good color from a variety of color test patches (e.g. like those in a MacBeth Color Checker). Such test patches have relatively simple spectral features that are broad, so the color matrix corrections generally work well for terrestrial scenes and people. Emission nebulae, with their unusual narrow line emissions are a special case and a custom color matrix correction tuned to such spectral emissions could provide more accurate color of those nebulae (but may not work as well on star color). The point is, all this is an approximation to achieve reasonably accurate natural color.
Skyglow. The largest factor in color of dim space objects is correctly assessing skyglow and skyglow gradients, regardless of method used, and then when subtracted, checking the resulting image for unnatural color shifts with scene intensity. There is no perfect solution. For a good example that shows the complexity we often face, see Astrophotography Image Processing with Images Made in Moderate Light Pollution. In this example, there is a natural gradient in brightness from the left edge of the image (which is near the galactic plane), to the right, out of the galactic plane, then there is a skyglow gradient from left to right due to light pollution from a major city to the left, and an airglow gradient with increasing airglow from top to bottom. Links to the raw data are after Figure 6, and links to online discussions are also there (including sometimes vitriolic exchanges when those using traditional methods came out with mangled color). Figure 9 in the above article shows samples from those trying the challenge. Note the discussion in this section about the histograms and how histogram equalizations mangle color (see also Figures 10a-10c in the above link for a terrestrial examples of detrimental effects of histogram equalization steps). Avoid doing these color destructive steps if you want natural color.
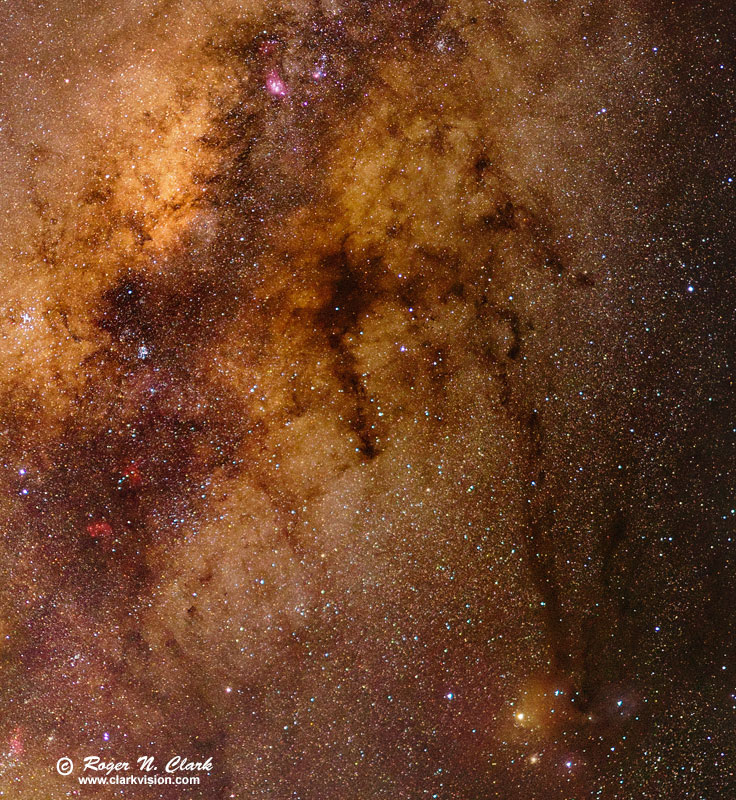
Follow known Color Photometry. Whether traditional linear workflow or modern raw converter workflow, choose the skyglow levels to subtract to give your best estimate of color versus intensity based on known photometry and science. Compare star colors with B-V values, and check for unnatural color gradients. For example, faint interstellar dust generally has consistent color as it fades into the deep space background, and would not turn blue except in rare circumstances (dust grain size decreases with position and starlight from a nearby star is scattered at a large angle, e.g. greater than 30 degrees). For examples of bluing with angle, compare the color of the daytime clear sky with angle from the sun (hide the sun from your view behind a tree, building or mountain. Interstellar dust involved in a dark nebula gets redder/browner moving into the dark nebula. We see this effect in Figures 1, and 10a-10c, especially around the "dark Horse" nebula to the right of the galactic center (Figure 11). This NASA APOD of Stars and Dust Across Corona Australis is another good illustration of this reddening effect. The APOD also shows local conditions where light is Rayleigh scattered from the two bright stars in a specific geometry making the local blue color around those stars, but not in other parts of the scene.
Deconvolution sharpening. Another criticism I have seen is that one should only do deconvolution sharpening on linear data. Again, an idea not based in reality. A stretched image simply has a different shape blur function than an unstretched image. Indeed, researchers developing algorithms for deconvolution also deconvolve tone curve images as well as film images with more complex tone curves. See the many scientific references at the end of this article: Adaptive Richardson-Lucy Image Deconvolution. It should also be noted that usually no one blur model works across the full field of an image because aberrations change across the image. Again, another approximation must be used for overall best results. This is also true for ordinary photography that includes depth of field. Different blur functions are needed to model the changing blur at different distances throughout the image.
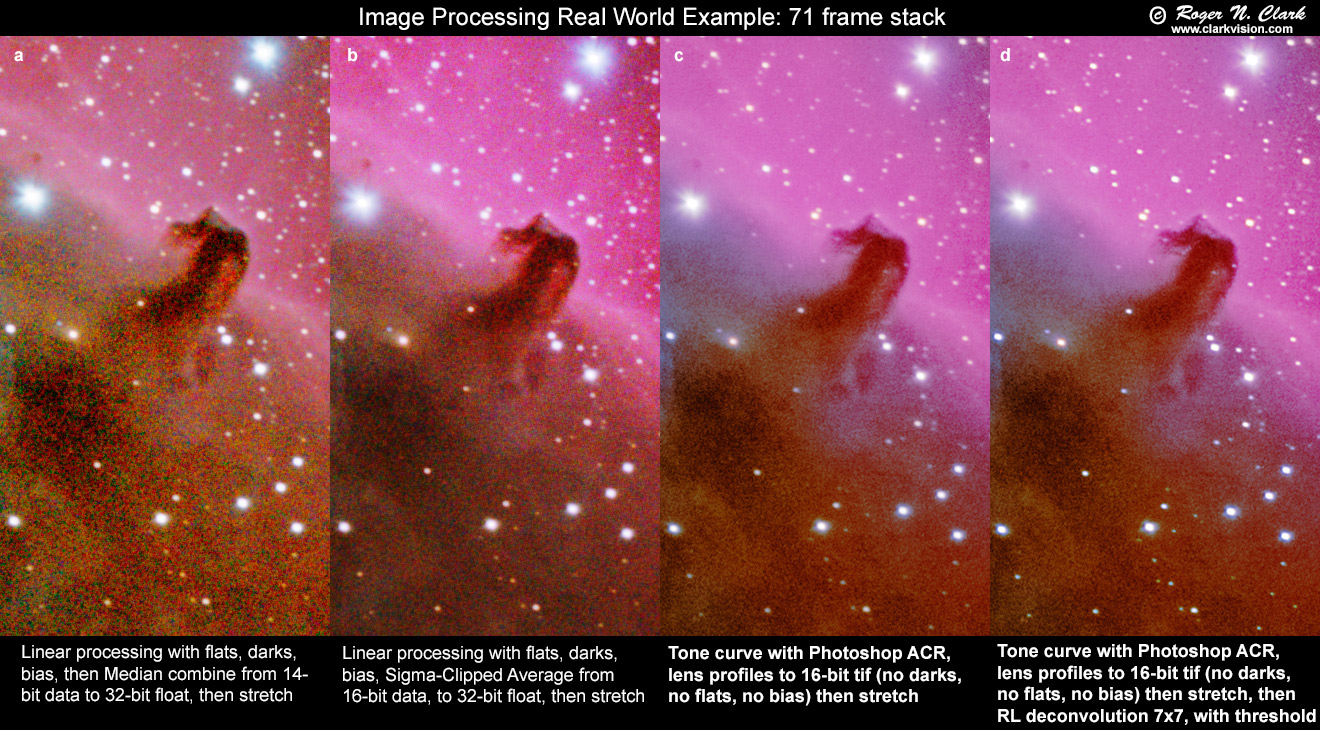
Stacking tone curve vs linear data. Another critique I've seen is that one must stack only linear data. Stacking improves signal-to-noise-ratio. Noise from frame to frame is a small percentage of the total dynamic range of the typical image. Over a short intensity range even tone curve data can be considered linear, and at lower intensities the BT.709 tone curve IS linear. So there is no problem stacking tone curve data, plus one has the advantage of lower noise from more advanced demosaicking algorithms in modern raw converters. And the bottom line is that I have yet to see a better image made with the traditional workflow with traditional astrophotography processing software, than made with the modern workflow when working with the same data. The noise in various methods is illustrated in Figure 12.
Consistent color, including natural color, requires attention to details, including scientific data and the processes that produce color (e.g. blue-absorbing interstellar dust).
Some in the amateur astronomy community have based color on some recently developed concepts and traditions that are not based on science, and now are attacking scientific evidence. I see similar attacks in many fields, and the tactics are similar, e.g. against climate change research, or scientists in the 2020 pandemic. Attacks include personal attacks. When such attacks are launched, it is a sign of desperation and lack of understanding the real problem by the attacker. It is a sign to ignore that attacker. Instead, look at real evidence. Another tactic is boasting they have shown the real solution to the problem, but will not show that solution and not show results from their solution that shows their particular solution is both better and more accurate. Those using good scientific methods know the limitations, show where results work and where they do not, and never launch personal attacks on people. I believe I have discussed both the positives and negatives of multiple astrophotography color production methods in this article and demonstrated results showing color verified by scientific data.
In this article and many other articles on this website, I give concrete examples. The results demonstrate that when one uses scientific data (e.g. color photometry) and basic understanding of physical processes (e.g. interstellar dust is brownish and increasing dust reddens), one can choose black points that give consistent color with scene intensity and that is based in reality.
I am not stressing or advocating that all images made with digital cameras should/need to be natural color. Many photographers simply want to make pretty pictures and precise natural color is not their goal. That is fine. But if you do want to produce natural color, or at least make images close to natural color, then the ideas and methods I discuss in this article are important to consider, regardless of traditional or modern workflow.
Advantages of the Modern Workflow. The modern workflow uses digital camera raw converters as a first step. Modern raw converters include newer Bayer matrix color demosaicing algorithms, plus newer sharpening and smoothing algorithms (e.g. Goossens et al., 2015) than are typically available in astrophotography specific software. Digital camera raw converters also include traditional workflow applied in linear intensity from the sensor. As such, the modern workflow makes production of color images from consumer digital cameras far simpler than the traditional workflow where one must do all the data reduction steps by hand. The modern method allows one to produce very good images with a modest amount of time and equipment. In fact, for all the whining of the "traditionalists," I have yet to see a better image made with the traditional workflow with traditional astrophotography processing software, than made with the modern workflow when working with the same data. Usually I see them complain that they produce better images, but with many times more exposure with larger physical apertures and far more expensive equipment (another sign they missed the point). I make raw data available (see above links in "The Modern Method Of Astrophotography Color Production" section)--show me how to do it better. And for the "purists" wanting a linear workflow, some digital camera raw converters will output linear data as opposed to tone curve data, so one can have their cake and eat it too. The traditionalists who are complaining don't seem to fully understand the problem, the approximations needed in any natural color workflow, and are holding on to their proverbial buggy whips to drive their car.
Appendix 1, below, gives links to NASA Astronomy Pictures of the Day (APOD) that used my modern methods, and to other users who have and are producing impressive color images with my methods.
Above all, push back on extremists claiming their way is the one true way and launching personal attacks. Link to this and/or other articles to counter extremists. In astrophotography processing of color images, there are multiple ways to produce good natural color.
For purists wanting to do the traditional workflow, start with a color chart imaged in daylight and process your image data just like you would your astrophotos. Prove that you can get reasonable matches to the colors in the color chart. If you can't demonstrate that, then you have no business criticizing others. Hint: anyone with a phone camera, DSLR, mirrorless, or point and shoot digital camera can pass this test in a few seconds! It is not hard--just point and click with the camera in daylight white balance. Next try it on bright stars, out of focus (Figure 7), then bright nebulae like M42 (a simple 10 to 60 second exposure should show great colors); of course you will need tracking. Once you have established that you can get natural colors in these situations, correcting for skyglow and gradients that produces similar colors, based on simple science data can launch you on your way to making beautiful natural color images of the night sky. The skyglow corrections (subtractions) are the real challenge, regardless of how dark your skies are and which method you use.
The bottom line is that today we have many tools and data to verify color in our images of the night sky, regardless of method used in reducing our data.
NASA APOD: Dark Dust and Colorful Clouds near Antares This is the best image of this area that I have ever seen.
NASA APOD: Spiral Meteor through the Heart Nebula
NASA APOD: Eclipsed Moon in the Morning
M45 - Pleiades and surrounding dust from very dark skies
The Sadr Region of the Milky Way with a cheap barn door tracker I made
M31 - Andromeda Galaxy [20mins exposure]
Veil Nebula from bortle 2 skies with unmodded DSLR
The Witch Head nebula looking at Rigel
The Pleiades (M45) - The Seven Sisters
If you have an interesting astro image processed using my modern methods, please let me know and I'll consider including a link here.
References and Further Reading
Clarkvision.com Astrophoto Gallery.
Clarkvision.com Nightscapes Gallery.
Goossens, B., H. Luong, J. Aelterman, A. Pizurica and W. Philips, 2015, An Overview of State-of-the-Art Denoising and Demosaicking Techniques: Toward a Unified Framework for Handling Artifacts During Image Reconstruction, 2015 International Image Sensor Workshop. Goossens.pdf.
The Night Photography Series:
| Home | Galleries | Articles | Reviews | Best Gear | Science | New | About | Contact |
http://clarkvision.com/articles/astrophotography-color-and-critics/
First Published May 29, 2020
Last updated October 30, 2025